Portugal Weather by Month (2026 Data)
Portugal weather by month from official IPMA 1991-2020 normals: 8 stations, sea temperatures, records and the warming trend - in Celsius and Fahrenheit.
- Published
- Updated
- 7 sources
- 6 statistics
- 9 min read

- BA in Communication & Cultural Studies, Faculdade de Letras da Universidade do Porto (FLUP); MA candidate in Urban Anthropology
- Former urban culture contributor to Publico (Fugas supplement) and Revista Visao
- 8+ years documenting the gentrification and preservation of traditional Porto commerce for municipal cultural archives
- Field researcher for independent monographs on Northern Portuguese vernacular dining and tavern culture
- Born and raised in Miragaia; 4th-generation Tripeiro living in Cedofeita, where his family has run small businesses since the 1960s
- Covers urban culture, historic tascas, contemporary architecture and the Bonfim, Cedofeita, Campanha and Fontainhas neighbourhoods
- Tests every venue anonymously on foot and refuses all comped meals, so recommendations stay unsponsored

- BA in Journalism, Universidade Nova de Lisboa; Postgraduate Diploma in Wine Business & Gastronomic Criticism, Escola de Hotelaria e Turismo do Porto (EHTP)
- Former Deputy Editor at Time Out Portugal and Lifestyle Editor at Observador
- Member of the Portuguese Guild of Gastronomic and Wine Journalists (APGCV)
- Panelist and juror for regional gastronomy competitions, including Northern Portugal Craft Beer and D.O.C. Douro wine panels
- Advisor to independent cultural trusts focusing on architectural preservation in UNESCO World Heritage zones
- Porto native (Foz do Douro); 14+ years directing lifestyle, wine and travel coverage across Porto, London and Lisbon
- Enforces the zero-paid-placement policy - every vineyard, boutique stay and dining room featured earns its place on editorial merit
Key findings
- 15.66 °CMainland Portugal's annual mean temperature is 15.66 °C (60.2 °F) in IPMA's 1991-2020 normal.
- 47.3 °CPortugal's record high is 47.3 °C (117.1 °F) at Amareleja, set on 1 August 2003.
- -16.0 °CThe official record low of -16.0 °C (3.2 °F) was set at Penhas da Saude in 1954 and 1956.
- 20.0 °CFunchal on Madeira is Portugal's warmest station, with a 20.0 °C (68 °F) annual mean.
- +0.3 °CPortugal has warmed at about +0.3 °C per decade in every region since the 1970s.
- 21.7 °CThe Algarve sea peaks at 21.7 °C (71.1 °F) in August, the warmest of Portugal's three coasts.
Mainland Portugal fits in one line of latitude span, yet its January nights range from subtropical Faro to a frost-prone interior - and its official normals say so in hard numbers. This page counts the country's weather the way its national meteorological service does: month by month, station by station, from IPMA's 1991-2020 climate normals for eight stations, from the Algarve to Tras-os-Montes and out to Madeira and the Azores1.
Everything here is checked against the source: the tables, the charts and every number in the text come from IPMA's own fichas, from its official extremes list, or - where no official service publishes monthly data - from a labelled satellite aggregator. The Fahrenheit tables are ours, converted from the originals2.
Portugal weather by month: the one-minute answer
The Portugal temperature by month, in one sweep: winter days run in the mid-50s to low-60s Fahrenheit (12-17 C highs) almost everywhere, summer days reach the high 80s to low 90s F (31-34 C in the interior, 25-29 C on the coasts), and nights stay mild except in the north-east interior, where January lows average around freezing1. The chart above shows Lisbon's three curves - daytime highs, night lows and the mean - and the shape they make is the shape of the whole country: a gentle winter trough and a long, flat summer plateau that runs from June well into September.
The Portugal average temperature by month, taken across our eight stations, sits near 10-12 C (50-54 F) in January, crosses 15-18 C (59-64 F) in April, and spends July and August between 19.9 and 24.7 C (68-76 F) as a monthly mean1. What changes from station to station is not the shape of the year but its intensity: the interior swings hardest, the islands barely swing at all.
Weather in Portugal by month is therefore less about four seasons and more about two: a green, changeable half from October to March, and a dry, rock-steady half from April to September. The tables in the city sections below give every number; the sections after that explain the differences - and the Fahrenheit table converts it all2.
- Daily high (TX)
- Daily low (TN)
- Mean (TT)
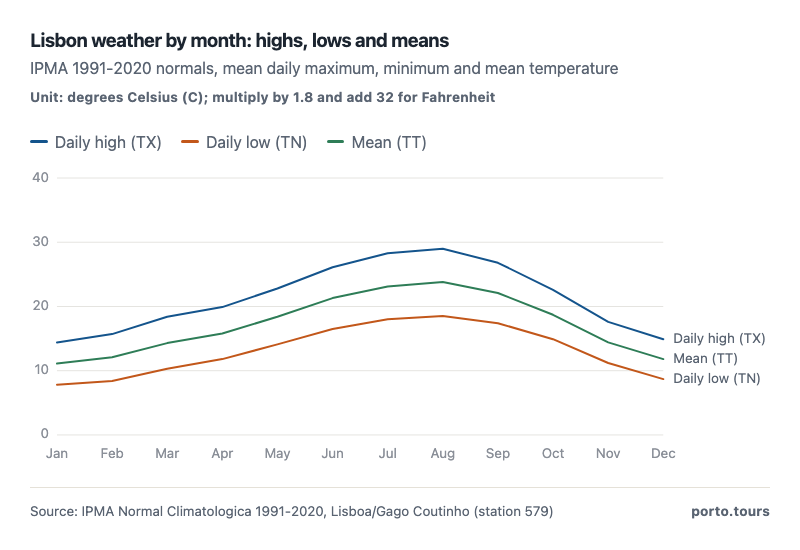
- Lisbon's mean daily high climbs from 14.4 C in January to 29.0 C in August.
- August nights average 18.5 C - no winter month averages below 7.8 C.
- The three curves stay 10-11 C apart all year: mild nights, warm days.
| Jan | 14.4 | 7.8 | 11.1 |
| Feb | 15.7 | 8.4 | 12.1 |
| Mar | 18.4 | 10.3 | 14.3 |
| Apr | 19.9 | 11.8 | 15.8 |
| May | 22.8 | 14.1 | 18.4 |
| June | 26.1 | 16.5 | 21.3 |
| July | 28.3 | 18.0 | 23.1 |
| Aug | 29.0 | 18.5 | 23.8 |
| Sept | 26.8 | 17.4 | 22.1 |
| Oct | 22.6 | 14.9 | 18.7 |
| Nov | 17.6 | 11.2 | 14.4 |
| Dec | 14.9 | 8.7 | 11.8 |
| Year | 21.4 | 13.1 | 17.3 |
Portugal climate by month: three zones, two coasts, one archipelago effect
The year runs through three different climates on the same calendar. Koppen's map gives most of the land south of the Tagus and the inland Douro Valley a hot-summer Mediterranean climate (Csa); the north of the Tagus and the southwest coast get the milder warm-summer version (Csb); and a small pocket of inland Alentejo is dry enough to count as cold semi-arid (BSk). The Azores sit in their own humid-subtropical class (Cfa)3.
The Portugal seasons by month follow the Atlantic more than the Mediterranean in the north, and the Mediterranean more than the Atlantic in the south. The clearest way to see it is the continentality chart below: Braganca's mean temperature swings 17.2 C between July and January, Lisbon's swings 12.0 C, and Ponta Delgada in the Azores just 6.7 C2. The same geography explains the frost record: Braganca averages 53.4 frost days a year, Lisbon 0.1 and Faro zero - in an average year the Algarve simply does not freeze1.
The annual summary table collects all eight stations: annual means from 12.9 C (Braganca) to 18.2 C (Faro) on the mainland, 20.0 C in Funchal, and the January and July means that drive every packing decision a traveller makes1. Read the two columns together and the strategy writes itself: the July column says where to book for heat, the January column says where to escape to in winter, and the annual mean says how big the swing between the two will feel where you are standing2.
- Lisboa
- Porto
- Faro
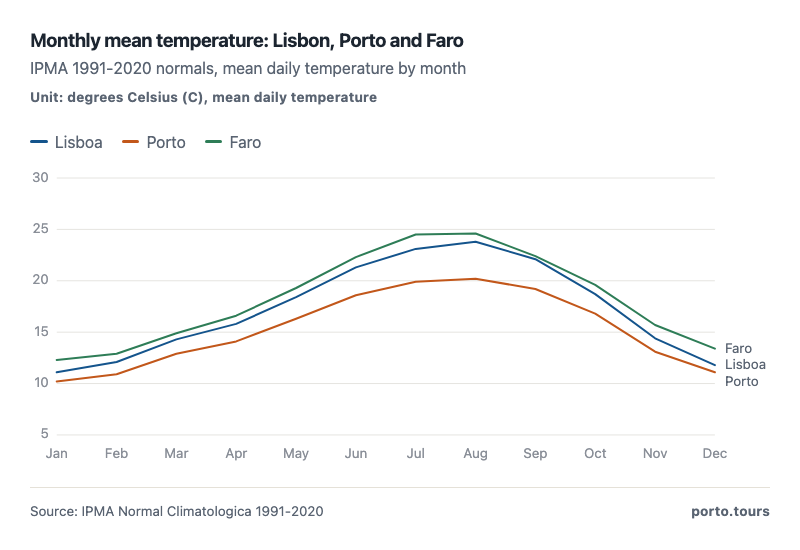
- Faro is the warmest of the three in every month except July-August, when Lisbon's highs catch up.
- Porto trails Lisbon by 1-3 C all year and by 3.6 C in January.
- All three cities sit between 10.2 C and 24.6 C in an average month.
| Csa | Hot-summer Mediterranean | South of the Tagus, inland Douro Valley, Madeira |
| Csb | Warm-summer Mediterranean | North of the Tagus, Costa Vicentina |
| BSk | Cold semi-arid | Small pockets of inland Alentejo |
| Cfa | Humid subtropical | Azores archipelago |
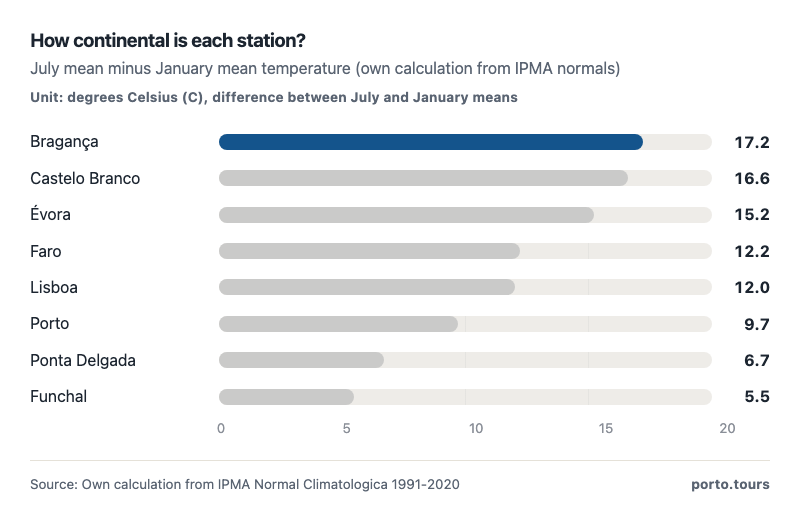
- Braganca swings 17.2 C between seasons - the most continental station in the set.
- Ponta Delgada in the Azores swings just 6.7 C - the most oceanic.
- Funchal swings 5.5 C between July and January; its monthly means stay between 16.8 and 23.7 C all year.
| Lisboa (Gago Coutinho) | 17.3 | 21.4 | 13.1 | 11.1 | 23.1 |
| Porto (Pedras Rubras) | 15.3 | 19.3 | 11.2 | 10.2 | 19.9 |
| Faro | 18.2 | 22.3 | 14.0 | 12.3 | 24.5 |
| Bragança | 12.9 | 18.9 | 6.9 | 4.8 | 22.0 |
| Castelo Branco | 16.1 | 21.6 | 10.6 | 8.3 | 24.9 |
| Évora | 16.6 | 23.1 | 10.1 | 9.3 | 24.5 |
| Funchal (Madeira) | 20.0 | 22.9 | 17.0 | 17.1 | 22.6 |
| Ponta Delgada (Azores) | 18.2 | 20.9 | 15.5 | 15.1 | 21.8 |
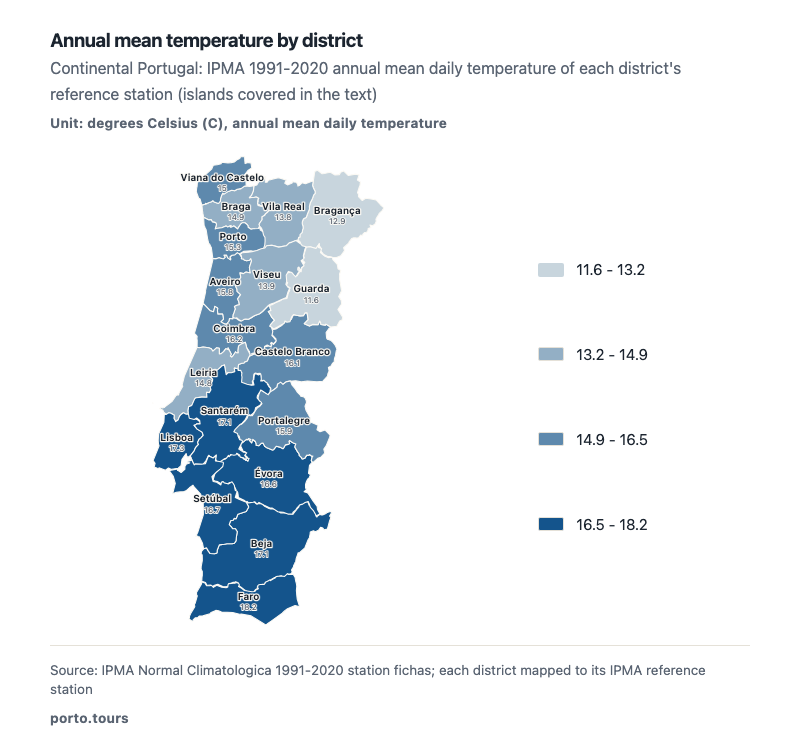
- Madeira is the warmest district at 20.0 C - Funchal's coast never leaves the subtropics.
- Guarda is the coldest at 11.6 C: the Serra da Estrela effect.
- The coastal spread is gentle: Viana do Castelo 15.0 C to Faro 18.2 C.
Weather by month, city by city
Lisbon, Portugal: weather by month
The capital is the reference point most visitors start from, and the capital's monthly pattern is the gentlest of the mainland cities: August highs of 29.0 C (84.2 F), January highs of 14.4 C (57.9 F), and a monthly mean that never drops below 11.1 C (52 F)1. Lisbon's Lisbon, Portugal average temperature by month also shows the famous shoulder-season sweet spots: May (18.4 C mean, 64.3 F) and late September (22.1 C mean, 71.8 F) pair summer warmth with pre-heat-wave crowds1. Frost is a non-event here - 0.1 days a year - and the 1991-2020 window's hottest spell touched 44.0 C (111.2 F) exactly once, on 4 August 20181.
Faro, Portugal: weather by month - the Algarve benchmark
The Algarve, Portugal weather by month story is the winter-warmth story: Faro's January mean of 12.3 C (54.1 F) beats Lisbon's by 1.2 C and Porto's by 2.1 C, and its December and March means out-warm every other mainland station's1. The Algarve benchmark peaks with 29.4 C (84.9 F) July highs and a sea warm enough to swim from May to October. Two caveats keep it honest: Faro's normal is a hybrid series (IPMA flags it), and the region's summer heat now regularly brushes 40 C (104 F) - the 1991-2020 window recorded 44.3 C (111.7 F) once, in July 20041.
| Jan | 14.0 | 6.4 | 10.2 |
| Feb | 15.0 | 6.8 | 10.9 |
| Mar | 17.0 | 8.8 | 12.9 |
| Apr | 18.1 | 10.1 | 14.1 |
| May | 20.3 | 12.3 | 16.3 |
| June | 22.7 | 14.5 | 18.6 |
| July | 24.3 | 15.5 | 19.9 |
| Aug | 24.8 | 15.7 | 20.2 |
| Sept | 23.5 | 14.8 | 19.2 |
| Oct | 20.7 | 12.9 | 16.8 |
| Nov | 16.8 | 9.4 | 13.1 |
| Dec | 14.7 | 7.6 | 11.1 |
| Year | 19.3 | 11.2 | 15.3 |
| Jan | 16.3 | 8.3 | 12.3 |
| Feb | 17.0 | 8.8 | 12.9 |
| Mar | 18.9 | 10.8 | 14.9 |
| Apr | 20.7 | 12.4 | 16.6 |
| May | 23.5 | 15.0 | 19.3 |
| June | 26.8 | 17.8 | 22.3 |
| July | 29.4 | 19.6 | 24.5 |
| Aug | 29.2 | 19.9 | 24.6 |
| Sept | 26.4 | 18.3 | 22.4 |
| Oct | 23.3 | 15.8 | 19.6 |
| Nov | 19.6 | 11.9 | 15.7 |
| Dec | 17.1 | 9.7 | 13.4 |
| Year | 22.3 | 14.0 | 18.2 |
Portugal weather by month, Fahrenheit
If you think in Fahrenheit, the conversion is a fixed formula - multiply the Celsius value by 1.8 and add 32 - so nothing is lost in translation, and the table below does it for the capital. The Lisbon, Portugal weather by month Fahrenheit picture reads like this: highs from 57.9 F in January to 84.2 F in August, lows from 46.0 F to 65.3 F, and an annual mean of 63.1 F2. For the other stations, convert any number from the tables above with the same formula; 25 C is 77 F, 30 C is 86 F, 35 C is 95 F2.
| Jan | 57.9 | 46.0 | 52.0 |
| Feb | 60.3 | 47.1 | 53.8 |
| Mar | 65.1 | 50.5 | 57.7 |
| Apr | 67.8 | 53.2 | 60.4 |
| May | 73.0 | 57.4 | 65.1 |
| June | 79.0 | 61.7 | 70.3 |
| July | 82.9 | 64.4 | 73.6 |
| Aug | 84.2 | 65.3 | 74.8 |
| Sept | 80.2 | 63.3 | 71.8 |
| Oct | 72.7 | 58.8 | 65.7 |
| Nov | 63.7 | 52.2 | 57.9 |
| Dec | 58.8 | 47.7 | 53.2 |
| Year | 70.5 | 55.6 | 63.1 |
Portugal water temperature by month: the Atlantic reality
Water is where Portugal stops being Mediterranean: the Atlantic cold current keeps the west coast braces-cold even in August. The Portugal sea temperature by month ranges from 13.8 C (56.8 F) off Porto in February to 21.7 C (71.1 F) off Faro in August - and the Algarve's corner of the coast is consistently 2-4 C warmer than the west-facing shores4. September beats June everywhere: the ocean lags the air by about two months, so the warmest swimming water arrives after the crowds leave.
One honesty note: IPMA publishes operational sea-temperature forecasts but no official monthly normals table, so these figures come from a labelled satellite-data aggregator (NOAA and Copernicus Marine inputs) rather than the national service - good enough for packing decisions, cited as such4.
Two month-by-month questions this page deliberately does not answer with tables: humidity and the UV index. IPMA's station fichas do carry mean relative humidity, and Portugal's June-July UV index reaches very high levels in the south, but the published series sit scattered across per-station documents - so we prefer a missing table to a shaky one2. Both belong on a follow-up page rather than in a footnote.
What the monthly tables do settle is comfort. Winter humidity along the northern coast makes Porto's 8 C lows feel damper than the number suggests, while Lisbon's Atlantic breeze keeps even the warmest nights (18.5 C in August, 65.3 F) sleepable without air conditioning - one reason the capital sells rooftop beds rather than chilled rooms1.
- Lisbon coast
- Porto coast
- Faro coast
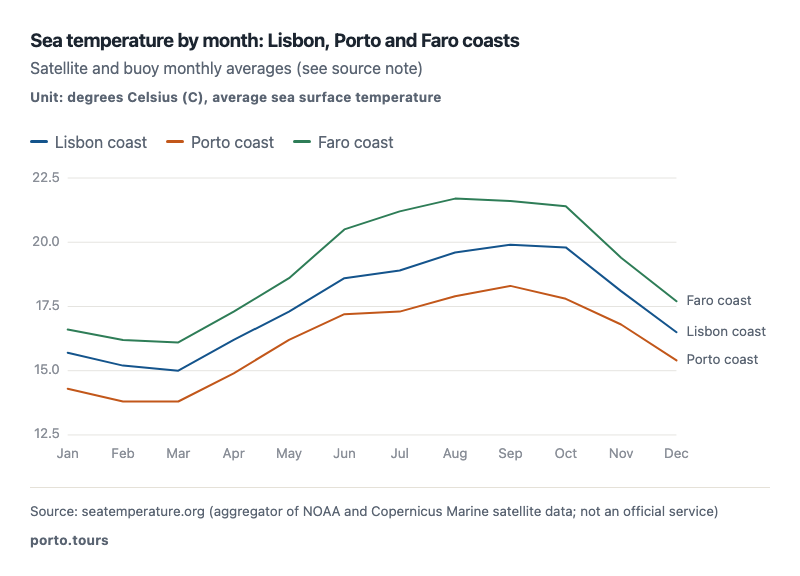
- The Algarve sea peaks at 21.7 C in August - about 4 C warmer than Porto's coast.
- Porto's sea never leaves the 13.8-18.3 C band: the Atlantic north stays brisk all summer.
- September is warmer than June on every coast - the ocean lags the air by about two months.
| Jan | 15.7 | 14.3 | 16.6 |
| Feb | 15.2 | 13.8 | 16.2 |
| Mar | 15.0 | 13.8 | 16.1 |
| Apr | 16.2 | 14.9 | 17.3 |
| May | 17.3 | 16.2 | 18.6 |
| June | 18.6 | 17.2 | 20.5 |
| July | 18.9 | 17.3 | 21.2 |
| Aug | 19.6 | 17.9 | 21.7 |
| Sept | 19.9 | 18.3 | 21.6 |
| Oct | 19.8 | 17.8 | 21.4 |
| Nov | 18.1 | 16.8 | 19.4 |
| Dec | 16.5 | 15.4 | 17.7 |
The islands: Portugal's two weather outliers
Madeira, Portugal: weather by month (Funchal)
Madeira's line is near-flat, and Funchal's normals prove it: monthly means from 16.8 C (62.2 F) in February to 23.7 C (74.7 F) in August, an annual mean of 20.0 C (68 F) - warmer than any mainland station in every single month of winter1. Madeira's trade-off is terrain: the island stacks a subtropical coast and a cool mountain top into a few kilometres, so the ficha describes the coast, not the peaks.
The Azores, Portugal: weather by month (Ponta Delgada)
Ponta Delgada's line sits between Lisbon's and Funchal's: Ponta Delgada runs 11.7-21.2 C (53.1-70.2 F) across the year with a 18.2 C (64.8 F) annual mean, and the smallest seasonal swing of the whole set (6.7 C)1. The price of that stability is changeability - Atlantic systems cross the islands in every month, which is why the Azores records (+32.2 C, -3.5 C) look tame next to the mainland's 47.3 and -16.05.
- Funchal (Madeira)
- Ponta Delgada (Azores)
- Lisboa
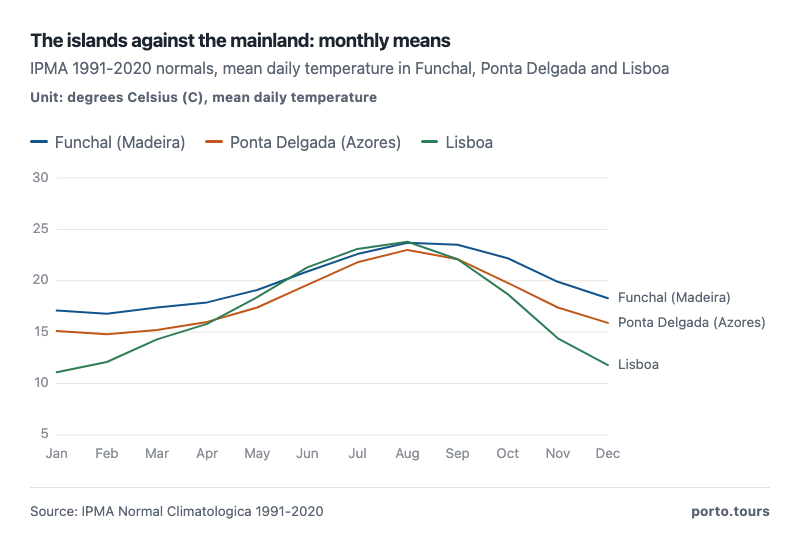
- Funchal stays between 16.8 and 23.7 C every month of the year.
- In winter Funchal is 5.7 C warmer than Lisbon; in summer only 0.1 C warmer.
- Ponta Delgada tracks Lisbon's curve, just 0.5-1.5 C cooler in the warm months.
| Funchal (Madeira) | 20.0 | February (16.8 C) | August (23.7 C) | 5.5 |
| Ponta Delgada (Azores) | 18.2 | February (11.7 C) | August (21.2 C) | 6.7 |
Records and the warming signal
Portugal's all-time extremes are bigger than most visitors expect. The official record high is 47.3 C (117.1 F) at Amareleja in the Alentejo interior, set on 1 August 2003; the record low is -16.0 C (3.2 F) at Penhas da Saude in the Serra da Estrela, reached twice, in February 1954 and February 19565. The same official list holds the strange ones: a night that never cooled below 32.0 C (89.6 F) in Faro, and a July day so cold the high was -10.2 C (13.6 F) in the mountains5.
The trend behind the normals is upward. Since the 1970s Portugal has warmed at about 0.3 C per decade in every region; 2025 came in at 16.47 C, +0.81 C above the 1991-2020 normal and fifth warmest since 1931 - behind 2022, 2023, 1997 and 2024, so four of the five warmest years are the last four6. Official scenarios put mainland Portugal about +2 C (moderate) to +4 C (high) warmer by 2100, with the islands projected between +2.3 and +4.9 C7. The hottest single month ever measured on the mainland - July 2022, a 25.14 C monthly mean - is what that trajectory looks like in practice6.
For the numbers on this page the implication is simple and worth stating: the 1991-2020 normals are the official baseline, but each new decade is running warmer than the last, so treat the tables as a floor for future summers rather than a ceiling2.
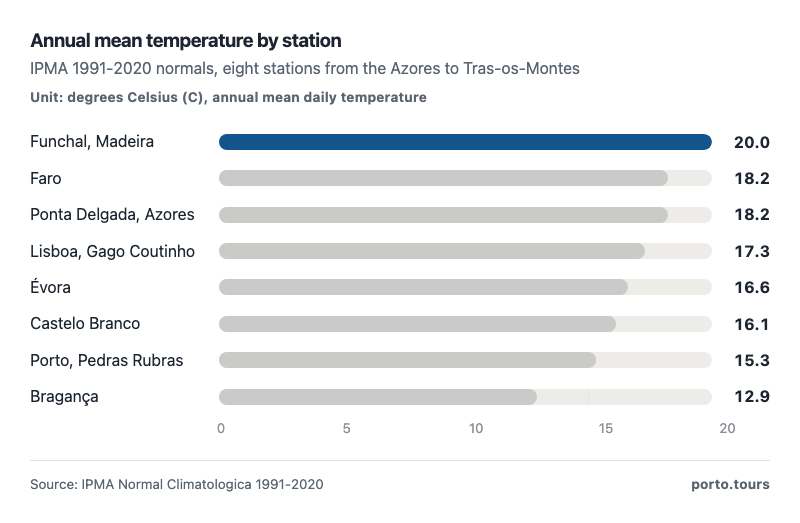
- Funchal on Madeira is Portugal's warmest station at 20.0 C - ahead of every mainland city.
- Braganca is the coldest at 12.9 C, five degrees below the Algarve.
- The mainland spread runs 12.9-18.2 C; the islands add 18.2-20.0 C.
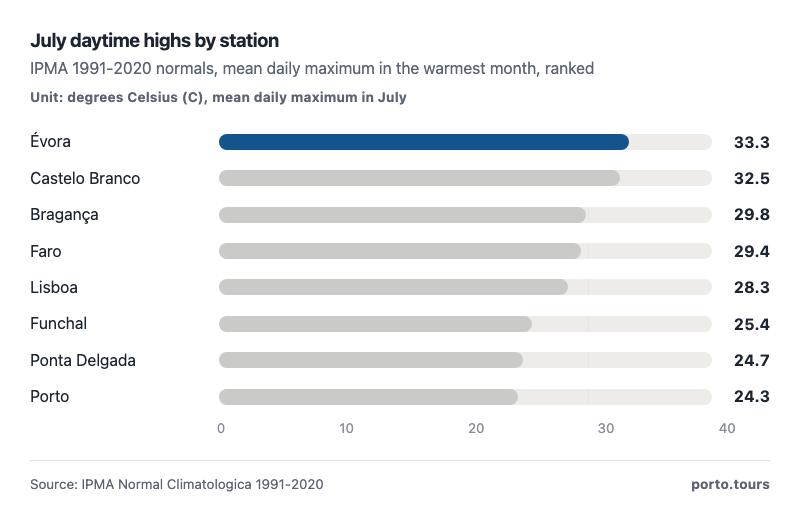
- Evora has the hottest July highs of the eight stations at 33.3 C.
- Braganca matches the big southern cities in July (29.8 C) despite its cold winters.
- Porto and Funchal stay coolest in July: 24.3 C and 25.4 C.
| Highest temperature | 47.3 C | Amareleja, 1 August 2003 |
| Lowest temperature | -16.0 C | Penhas da Saude, Feb 1954 and Feb 1956 |
| Highest daily minimum | 32.0 C | Faro, 26 July 2004 |
| Lowest daily maximum | -10.2 C | Penhas da Saude, 4 February 1954 |
| Azores highest / lowest | +32.2 C / -3.5 C | Pico island 1985 / Sao Jorge 1973 |
| Madeira highest / lowest | +39.1 C / -9.5 C | Quinta Grande 2023 / Bica da Cana 1993 |
| Observed warming since the 1970s | about +0.3 C per decade, all regions |
| Mainland annual normal 1991-2020 | 15.66 C |
| 2025 annual mean (5th warmest since 1931) | 16.47 C (+0.81 vs normal) |
| Five warmest years since 1931 | 2022, 2023, 1997, 2024, 2025 |
| Projected by 2100, moderate scenario | about +2 C (RCP4.5) |
| Projected by 2100, high scenario | about +4 C (RCP8.5) |
| Islands 2071-2100 (SSP scenarios) | +2.3 to +4.9 C |
Best time to visit Portugal, weather by month
Read the question off the tables above and three answers fall out. For beach weather, August wins on paper - 29.0 C Lisbon highs, 21.7 C Faro sea - but June and September deliver 90% of the warmth with cooler nights and none of the peak-heat risk1. For city trips, May and October are the mean-temperature sweet spots: Lisbon's 18.4 C and 18.7 C means make walking distances easy without the August scorcher1. For escaping winter entirely, the Algarve and Madeira are the only choices: Faro's January mean of 12.3 C (54.1 F) and Funchal's 16.8-17.1 C (62-63 F) winter means are the warmest air Portugal sells in the low season1.
The numbers also explain what to pack by month rather than by country: a real coat for Braganca-grade interior winters (January highs 9.1 C, 53 frost days a year), nothing heavier than a jumper for coastal winters, and air conditioning as a default choice for inland July-August nights, which in Evora and Castelo Branco stay around 16-18 C (61-64 F) but follow 33 C (91 F) days1.
- 6.6JanJ
- 7.3FebF
- 8.1MarM
- 8.1AprA
- 8.7MayM
- 9.6JunJ
- 10.3JulJ
- 10.5AugA
- 9.4SepS
- 7.7OctO
- 6.4NovN
- 6.2DecD
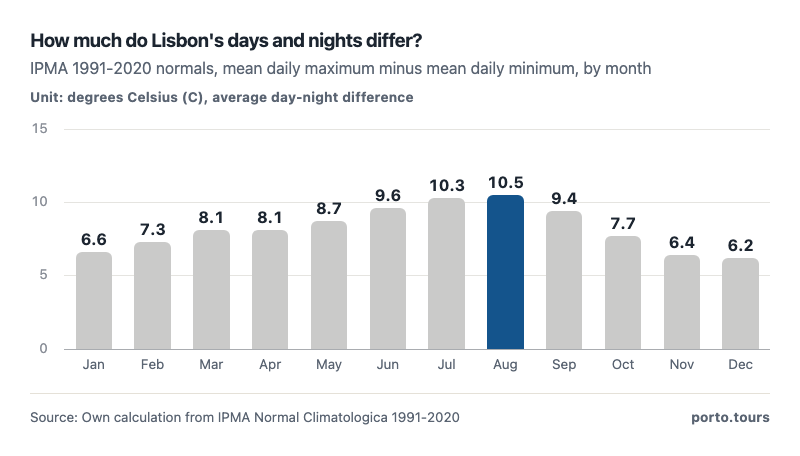
- Lisbon's day-night gap stays between 6.2 and 10.5 C all year.
- July has the widest gap: 28.3 C days against 18.0 C nights.
- Narrow gaps in winter (6.2-6.6 C) mean cloudy, even days and nights.
Conclusions
- Portugal weather by month is a two-season story: a mild, changeable October-March half and a dry, stable April-September half, with the annual mean at 15.66 C (60.2 F) on the mainland6.
- The north-south gap is real but modest - Faro's annual mean (18.2 C) is only 5.3 C warmer than Braganca's (12.9 C) - while the interior-to-coast gap in seasonal swing reaches 17.2 C vs 12.0 C2.
- The islands beat the mainland in winter: Funchal's 20.0 C annual mean and 16.8 C coldest month make Madeira the only part of Portugal where winter means never leave the low 60s F1.
- The extremes are official and violent: 47.3 C at Amareleja, -16.0 C at Penhas da Saude, a 32.0 C warm night in Faro - three numbers that kill any one-climate description of the country5.
- Every future decade runs warmer: +0.3 C per decade already observed, +2 to +4 C projected by 2100, so the 1991-2020 tables here are best read as a floor for coming summers6.
Microclimate matters within a single month as much as the monthly averages differ between months. Coastal neighbourhoods sit several degrees cooler than eastern ones on summer afternoons because of the Atlantic breeze, and the Douro valley inland runs hotter than any city figure suggests. Travellers sensitive to heat should treat the sea-temperature column as seriously as the air-temperature one: the ocean along the northern coast rarely exceeds 18 degrees even in August, which surprises visitors accustomed to the Mediterranean.
Methodology
- IPMA climate normals 1991-2020 for 8 stations (6 mainland, Madeira, Azores)
- Sea surface temperature: monthly averages for 3 coasts (labelled aggregator)
- Records: IPMA official extremes list; warming: APA REA 2026, IPMA, RNA2100
Definition. Normals are 30-year means (1991-2020) of the mean daily maximum (TX), mean daily minimum (TN) and mean daily temperature (TT) per calendar month, as published by IPMA v1.0/2024. Continentality is July TT minus January TT; the day-night range is TX minus TN; both are our calculations from the IPMA values. Fahrenheit conversions use C x 1.8 + 32.
Data sources. IPMA Normal Climatologica 1991-2020 station fichas (PDF, v1.0/2024); IPMA Extremos Climatologicos; APA Relatorio do Estado do Ambiente 2026 and IPMA Boletim Climatologico Anual 2025; peer-reviewed RCP scenarios for mainland Portugal; RNA2100 island projections; Kottek et al. 2006 (Koppen); seatemperature.org monthly sea temperatures (labelled aggregator).
Calculations. Continentality, day-night ranges, the annual-summary month columns and all Fahrenheit values are our calculations from the IPMA normals. The 0.3 C per decade trend and the 15.66 C national normal are IPMA/APA published figures.
Limitations. Normals describe 1991-2020; recent years run warmer (2025 was +0.81 C above the normal). Faro's normal is a hybrid series (IPMA flag). Sea temperatures come from a labelled aggregator because no official monthly SST normals table is published. Station normals describe each station's site (coast, airport, altitude), not the whole region. No year-by-year annual series was verifiable in extractable form, so the warming section uses official anchors instead of a trend chart.
Sources
- IPMA. “Normal Climatologica 1991-2020, station fichas v1.0/2024 (Lisboa, Porto, Faro, Braganca, Castelo Branco, Evora, Funchal, Ponta Delgada).” Instituto Portugues do Mar e da Atmosfera, 2024. ipma.pt. Accessed 2026-09-18. Back to text
- Porto Tours. “Own calculations (labelled).” own calculation, 2026. porto.tours. Accessed 2026-09-18. Back to text
- Kottek et al. 2006. “World map of the Koppen-Geiger climate classification updated.” Meteorologische Zeitschrift (scientific), 2006. koeppen-geiger.vu-wien.ac.at. Accessed 2026-09-18. Back to text
- World Sea Temperature (seatemperature.org). “Monthly average sea temperature: Lisbon, Porto, Faro (NOAA and Copernicus Marine satellite data) - labelled aggregator, not an official service.” seatemperature.org, 2026. seatemperature.org. Accessed 2026-09-18. Back to text
- IPMA. “Extremos climatologicos Portugal (all-time records).” Instituto Portugues do Mar e da Atmosfera, 2026. ipma.pt. Accessed 2026-09-18. Back to text
- APA / IPMA. “Relatorio do Estado do Ambiente 2026: precipitacao e temperatura; IPMA Boletim Climatologico Anual 2025.” Agencia Portuguesa do Ambiente; IPMA, 2026. rea.apambiente.pt. Accessed 2026-09-18. Back to text
- Portuguese peer-reviewed literature. “Observed climate change and scenarios for mainland Portugal: +2 C (RCP4.5) to +4 C (RCP8.5) by 2100.” peer-reviewed journal (ResearchGate record), 2020. researchgate.net. Accessed 2026-09-18. Back to text
About the author
Tiago Santos is a born-and-bred Tripeiro with nearly a decade chronicling Porto's shifting culinary and cultural landscape - from back-alley petisqueiras to contemporary architecture. A former contributor to Publico's Fugas supplement and Revista Visao, for this guide he turns official statistics and street-level knowledge into research visitors can check and cite.
Every figure on this page links to its source. How we research
Related research
More data on Porto's travel, costs and life from Porto Tours.
- WeatherPortugal Average Sunny Days per Year (2026 Data)3,044 h annual sunshine in Faro - Portugal's sunniest stationRead the research →
- WeatherPorto Weather by Month (2026 Data)15.3 °C Porto's annual mean temperature, August 20.2 to January 10.2 (IPMA 1991-2020)Read the research →
- WeatherPortugal Rainfall by Month (2026 Data)76% of Lisbon's yearly rain falls October-MarchRead the research →
- Cost of LivingHow Much Does It Cost to Live in Portugal? (2026 Data)EUR 1,591 a month to live in Portugal, single person, city centre (2026)Read the research →
- EnvironmentPortugal CO2 Emissions per Capita 2000-2023 (2026 Data)3.54 t CO2 emissions per capita in Portugal 2023, down 43% since 2000Read the research →
- Travel PlanningHow Much Is a Flight to Portugal? (2026 Data)USD 675 average round trip, New York to Lisbon (Kayak average)Read the research →