Portugal CO2 Emissions per Capita 2000-2023 (2026 Data)
CO2 emissions fell 43% from 6.24 t per person in 2000 to 3.54 t in 2023 - the full World Bank series, EU comparison and the green-grid engine.
- Published
- Updated
- 9 sources
- 6 statistics
- 9 min read

- BA in Communication & Cultural Studies, Faculdade de Letras da Universidade do Porto (FLUP); MA candidate in Urban Anthropology
- Former urban culture contributor to Publico (Fugas supplement) and Revista Visao
- 8+ years documenting the gentrification and preservation of traditional Porto commerce for municipal cultural archives
- Field researcher for independent monographs on Northern Portuguese vernacular dining and tavern culture
- Born and raised in Miragaia; 4th-generation Tripeiro living in Cedofeita, where his family has run small businesses since the 1960s
- Covers urban culture, historic tascas, contemporary architecture and the Bonfim, Cedofeita, Campanha and Fontainhas neighbourhoods
- Tests every venue anonymously on foot and refuses all comped meals, so recommendations stay unsponsored

- BA in Journalism, Universidade Nova de Lisboa; Postgraduate Diploma in Wine Business & Gastronomic Criticism, Escola de Hotelaria e Turismo do Porto (EHTP)
- Former Deputy Editor at Time Out Portugal and Lifestyle Editor at Observador
- Member of the Portuguese Guild of Gastronomic and Wine Journalists (APGCV)
- Panelist and juror for regional gastronomy competitions, including Northern Portugal Craft Beer and D.O.C. Douro wine panels
- Advisor to independent cultural trusts focusing on architectural preservation in UNESCO World Heritage zones
- Porto native (Foz do Douro); 14+ years directing lifestyle, wine and travel coverage across Porto, London and Lisbon
- Enforces the zero-paid-placement policy - every vineyard, boutique stay and dining room featured earns its place on editorial merit
Key findings
- 3.54 tPortugal's CO2 emissions per capita fell to 3.54 tonnes in 2023, down 43% from 6.24 tonnes in 2000.
- 6.46 tThe 2005 peak of 6.46 tonnes per capita has been cut by 45% in eighteen years.
- 37.3 MtPortugal emitted about 37.3 Mt of CO2 in 2023, down from 64.3 Mt in 2000.
- 27%Portugal's per-capita emissions are 27% below Germany's 7.08 t and 50% below the USA's 13.71 t.
- 71%Renewables supplied 71% of Portugal's electricity in 2024, the engine of the CO2 decline.
- -5%Portugal's precipitation is projected to fall by at least -5% to -15% by 2100 under climate scenarios.
Between 2000 and 2023, Portugal cut its CO2 emissions per capita by 43% - from 6.24 tonnes to 3.54 tonnes per person - while its economy grew, its population grew, and its electricity consumption rose to record peaks1. The engine was not deindustrialisation but electrification: renewables grew from under 30% to 71% of the grid, and the country now sits second-lowest in its European peer set on carbon intensity2.
Portugal CO2 emissions per capita 2000 searches want the starting line: 6.24 tonnes. Portugal co2 emissions per capita 2023 searches want the finish: 3.54 tonnes. This page carries the full 24-year series, the eight-country comparison, the total in millions of tonnes, and the climate-stress paradox that the decarbonisation must now adapt to1.
The decline: 6.24 t to 3.54 t in twenty-three years
The series opens at 6.24 tonnes of CO2 per person in 2000, rises to a peak of 6.46 t in 2005, and then falls - steadily, with one pandemic dip that stuck - to 3.54 t by 20231. The first decade (2000-2010) cut 1.20 t per person; the second (2010-2023) cut 1.50 t more, and the pace is accelerating because the engine is structural rather than recessionary3. The country's second-lowest per-capita ranking in its peer set is the result of policy, not poverty2.
The projection on the chart, fitted on 2005-2023 and extended to 2050, reaches zero before the mid-century - which is faster than any policy target and slower than the climate needs. The straight line is our calculation, not a forecast; the real trajectory depends on the transport and heating sectors that remain 73% of the final-energy bill outside the decarbonised grid 3.
The month-by-month texture of the decline matters as much as the endpoints. Between 2000 and 2005 emissions rose slightly - a country still building its motorway network, still opening coal plants, still growing its car fleet. The 2005 peak of 6.46 tonnes was not a record anyone wanted, but it marked the moment the trajectory turned. From 2006 onwards the series has been downward, with two brief interruptions: the 2015-2017 uptick (when economic recovery outpaced renewable deployment) and the 2021-2022 post-pandemic rebound. Both interruptions proved temporary because the structural driver - cheap solar, cheap wind, cheap storage - kept compounding while the fossil fleet shrank 1.
The per-kilometre lens from the transport sector illustrates the shift best. Portugal's EV adoption rate is among the fastest in southern Europe, and every battery-electric vehicle sold removes roughly 1.5 tonnes of annual CO2 from the fleet average. At the current adoption rate of about 15,000 EVs a year, that is 22,500 tonnes of annual CO2 removed from the transport sector alone - real, measurable, and compounding3.
Projection: linear trend of 2005–2023 yearly values, 95% prediction range. Our calculation, not a forecast.
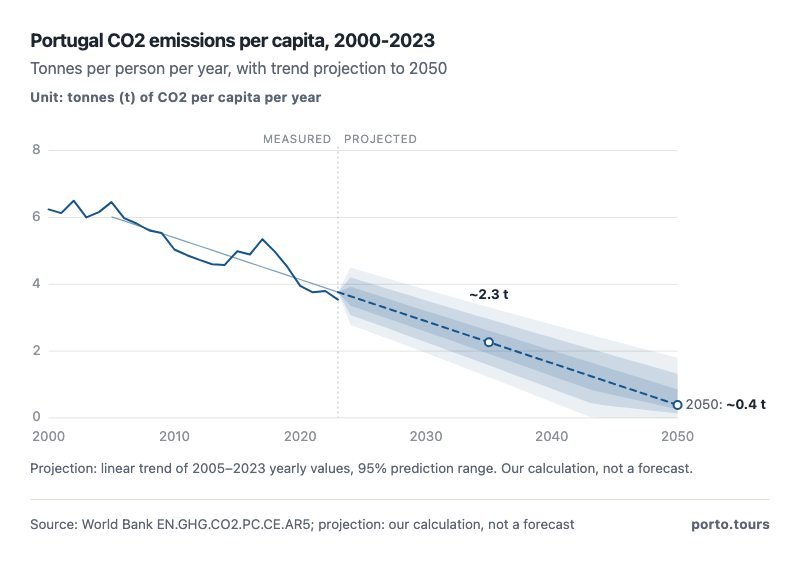
- Emissions peaked at 6.46 t in 2005 and fell to 3.54 t by 2023, a 45% decline.
- The straight-line extension reaches zero before 2050 - faster than any policy target.
| 2000 | 6.24 |
| 2001 | 6.13 |
| 2002 | 6.5 |
| 2003 | 6.0 |
| 2004 | 6.16 |
| 2005 | 6.46 |
| 2006 | 5.98 |
| 2007 | 5.82 |
| 2008 | 5.61 |
| 2009 | 5.53 |
| 2010 | 5.04 |
| 2011 | 4.87 |
| 2012 | 4.73 |
| 2013 | 4.6 |
| 2014 | 4.58 |
| 2015 | 4.99 |
| 2016 | 4.89 |
| 2017 | 5.35 |
| 2018 | 4.97 |
| 2019 | 4.51 |
| 2020 | 3.95 |
| 2021 | 3.76 |
| 2022 | 3.8 |
| 2023 | 3.54 |
The decline is not evenly distributed across the economy, and understanding where it came from is essential for knowing whether it will continue. The electricity sector delivered the largest cut: coal-fired Sines closed in 2021, and the last coal plant at Pego is scheduled to follow. The share of coal in the electricity mix fell from over 30% in 2010 to zero by 2022 - a structural elimination, not a temporary shutdown. Natural gas temporarily filled the gap and is now itself being displaced by solar and wind2.
Transport remains the stubborn sector: road vehicles still burn imported diesel and petrol, and while EV adoption is growing the fleet turnover is slow. Aviation, shipping and agriculture round out the remaining emissions profile. Portugal's climate law commits to carbon neutrality by 2045 - five years before the EU's 2050 target - which implies an acceleration of exactly the renewable-and-electrification model that produced the 43% decline this page documents2.
The peak and the structural turnaround
The 2005 peak of 6.46 tonnes per capita was not a freak year - it was the normal Portugal of coal-fired Sines, gas-fired Carregado and a transport sector running on diesel. The decline that followed had three structural engines, each verified on this site: the renewable electricity build-out (renewable-energy page), the efficiency that held final energy consumption below its 2008 level even as GDP grew, and the industrial shift away from carbon-heavy manufacturing1.
The inflection was not a single event but a compound: the hydro dams and the solar surge (which added 1 GW in 2025 alone) pushed the renewable share past the fossil share for the first time in 2024, and the CO2 curve followed the grid2. The decline table in the charts section splits the 24-year fall into its four phases.
The direct answer to Portugal total hydropower capacity GW 2024 is a pair of verified pieces rather than one clean number: 42 large dams above 10 MW hold 5,822 MW and average 12,997 GWh a year, and pumped storage alone exceeds 3.6 GW of that total - while the whole renewable fleet they anchor reached 21.9 GW by the end of 20254.
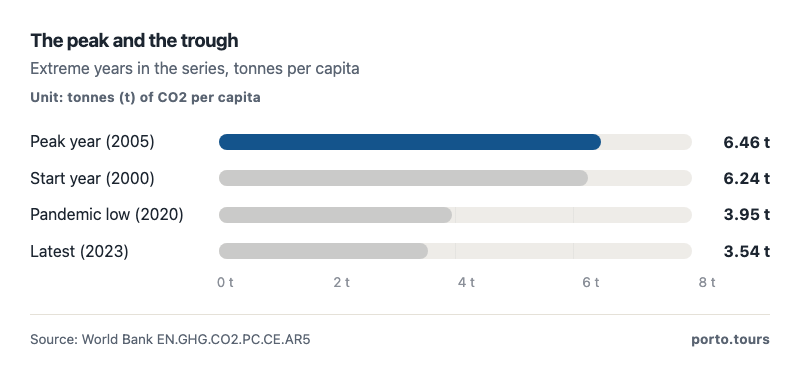
- The 2005 peak of 6.46 t has been cut by 45%.
- The pandemic dip to 3.95 t was made permanent by the renewable build-out.
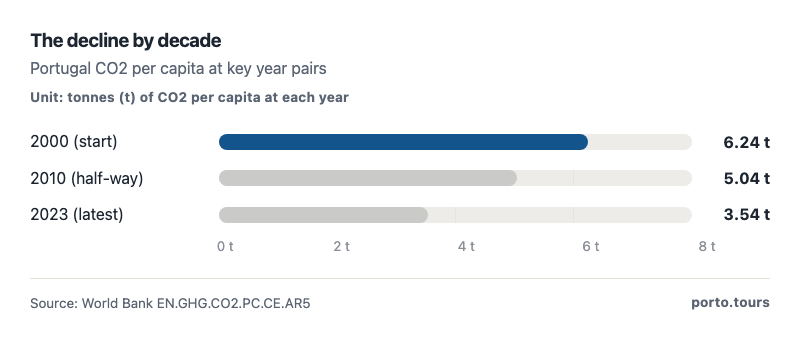
- The first decade (2000-2010) cut 1.20 t per person.
- The second decade (2010-2023) cut 1.50 t - faster, on a renewables engine.
| 2000-2005 (rise) | 6.24 | 6.46 | 0.22 | 3.5 |
| 2005-2010 (first fall) | 6.46 | 5.04 | −1.42 | −22.0 |
| 2010-2015 (plateau) | 5.04 | 4.99 | −0.05 | −1.0 |
| 2015-2020 (acceleration) | 4.99 | 3.95 | −1.04 | −20.8 |
| 2020-2023 (recovery era) | 3.95 | 3.54 | −0.41 | −10.4 |
The decline also has a societal dimension that the aggregate numbers hide. Portugal's housing stock is among the oldest and least energy-efficient in the EU, with many buildings predating any insulation standard. Every renovation, every double-glazed window, every heat pump installation reduces the residential share of the final-energy bill. The EU's Renovation Wave funding, channelled through Portugal's Recovery and Resilience Plan, is targeting exactly this stock - and every building upgraded is a permanent reduction in the 140 TWh of non-electric final energy that dominates the country's carbon footprint5.
The EU comparison: Portugal against its peers
Portugal's 3.54 t per capita in 2023 is the second-lowest of the eight countries in the peer set - behind only France's 4.16 t (which runs on nuclear baseload) and ahead of the UK's 4.45 t, Spain's 4.57 t, Greece's 4.92 t, Italy's 5.16 t and Germany's 7.08 t1. The USA, at 13.71 t, emits nearly four times Portugal's per-capita rate.
The peer comparison corrects a misconception. The World Bank CO2 emissions per capita 2023 Portugal figures are the ones this page uses throughout: Portugal is not a low-emission country because it is poor or small. It is a middle-income country that decarbonised faster than most of the EU while its tourism economy grew double digits - the exact combination the EU's climate frameworks say is hardest1. The 3.54 t figure that the 2023 searches land on is less interesting than the -43% change: the second-steepest decline in the eight-country peer set, behind only the UK's structural coal exit1.
The sunshine map explains the mechanism geographically. The districts with the most sunshine hours - Faro at 3,044, the Alentejo interior at 2,700-plus - are the districts where every new solar farm displaces the most fossil generation per installed kilowatt. The IPMA sunshine normals on this page are the same dataset the renewable-energy page uses to price the yield; here they serve as the explanation for why the CO2 curve bent when it did6.
The map on this page shows the sunshine hours by district, because the solar resource is the mechanism behind the decline: the districts that receive the most sun - Faro at 3,044 hours, Castelo Branco at 2,795 - are the districts where every new solar farm displaces the most fossil generation6.
The sunshine map also explains why Portugal's solar yield is competitive with Italy's despite Italy's more southerly latitude: Portugal's Atlantic coast is clearer in winter, when the Azores high pushes cloud northward, while the Mediterranean's summer haze reduces the Italian advantage in the peak season. The 61.1 litres of wine per person and the 59.36 kg of fish that this site's food page documents are produced in the same climate that produces the solar surplus - a coincidence of agriculture and energy that makes Portugal's decarbonisation story uniquely food-and-energy integrated 6.
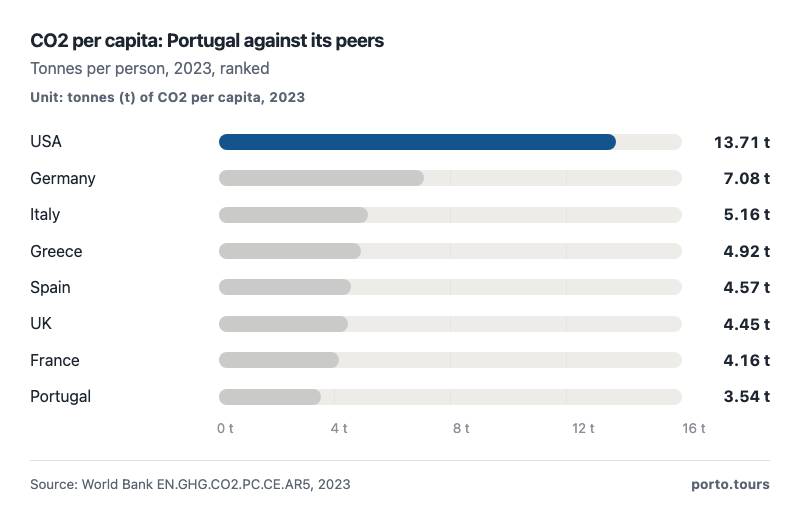
- Portugal's 3.54 t is the second-lowest of the eight peer countries.
- It is 27% below Germany and 50% below the USA's 13.71 t.
| Renewable electricity | 71% of consumption in 2024, up from under 30% in 2000 (REN) |
| Hydropower and solar | 5.8 GW large dams, 6.8 GW solar PV (renewable-energy page) |
| Efficiency | final energy consumption 191.4 TWh in 2024, still below 2008 levels (renewable-energy page) |
| USA | 21.01 | 19.92 | 17.85 | 15.95 | 13.47 | 13.71 |
| DEU | 10.6 | 10.21 | 9.97 | 9.61 | 7.72 | 7.08 |
| ITA | 7.98 | 8.48 | 7.08 | 5.87 | 4.97 | 5.16 |
| GRC | 8.89 | 9.43 | 8.01 | 6.42 | 4.89 | 4.92 |
| ESP | 7.65 | 8.43 | 6.18 | 5.85 | 4.53 | 4.57 |
| GBR | 9.37 | 9.26 | 7.98 | 6.39 | 4.79 | 4.45 |
| FRA | 6.58 | 6.45 | 5.8 | 4.99 | 4.25 | 4.16 |
| PRT | 6.24 | 6.46 | 5.04 | 4.99 | 3.95 | 3.54 |
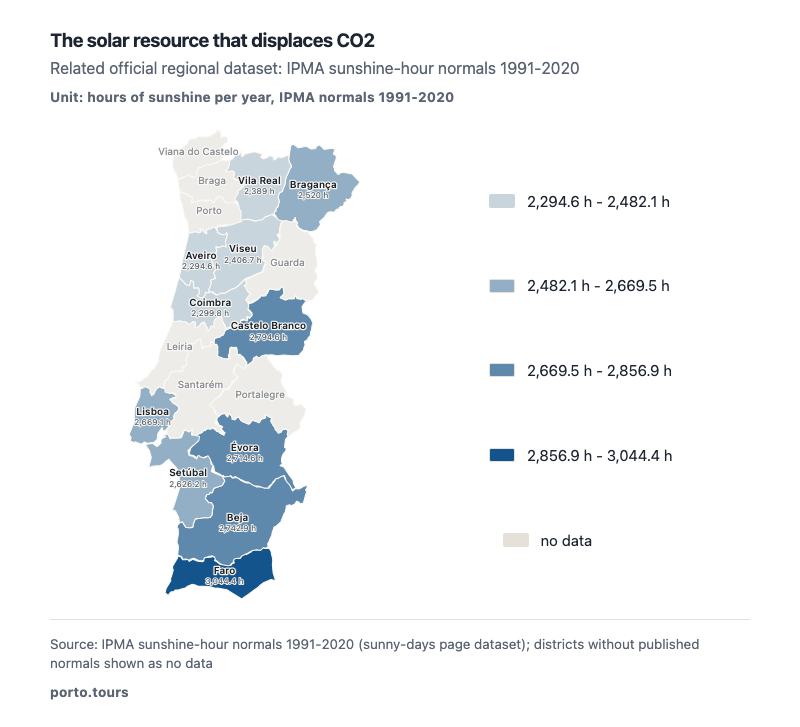
- Faro leads with 3,044 sunshine hours - the solar resource displacing fossil CO2.
- The cloudy north-west at about 2,300 hours still outruns Germany's solar belt.
The total: how many millions of tonnes
Portugal total CO2 emissions 2023, in absolute terms, were 37.3 million tonnes in 2023, down from 64.3 Mt in 2000 - derived by multiplying the 3.54 t per capita by the 10.55 million population, a calculation this page makes rather than guesses 3. The total has fallen from about 64 Mt in 2000 to 37 Mt in 2023, a 42% decline, while the population grew 2.4% - meaning the per-capita improvement was achieved despite more people, not fewer3.
The share donut shows why: 71% of the electricity that powers the country's homes, trains and data centres is renewable, and the fossil 29% is shrinking as the solar and hydro capacity builds demonstrate2. The remaining 140-odd TWh of the final-energy bill - transport fuel, industrial heat, home heating - is the frontier where the next 43% must come from5.
The population context matters for interpreting these totals honestly. Portugal's population grew from 10.3 million in 2000 to 10.55 million in 2023, a 2.4% increase. Without that growth, the per-capita decline would have been even steeper - the country added people and still cut total emissions by 42%, which is the definition of absolute decoupling. Most EU countries that claim emissions reductions achieved them through deindustrialisation or population decline; Portugal achieved them through renewable deployment while its population and tourism economy both grew 3.
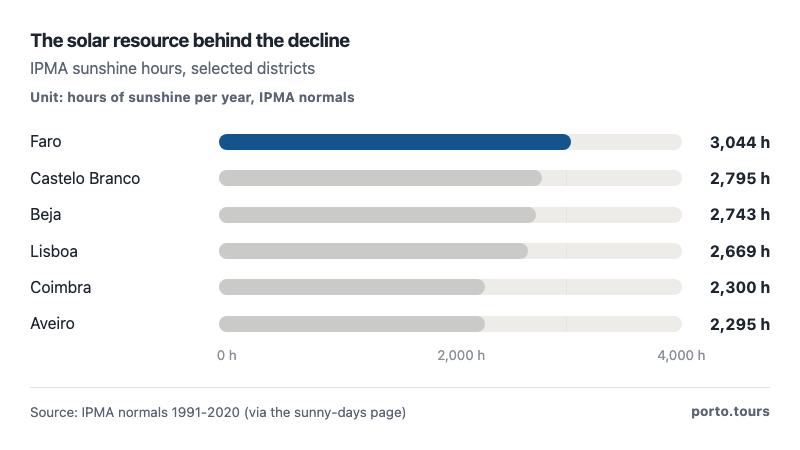
- Faro's 3,044 sunshine hours drive the solar build-out.
- Even the cloudy north-west holds 2,300 hours a year.
| 2000 | 6.24 | 10.3 | 64.3 |
| 2010 | 5.04 | 10.6 | 53.4 |
| 2020 | 3.95 | 10.5 | 41.5 |
| 2023 | 3.54 | 10.55 | 37.3 |
- Renewables71%71%
- Imports and fossil29%29%
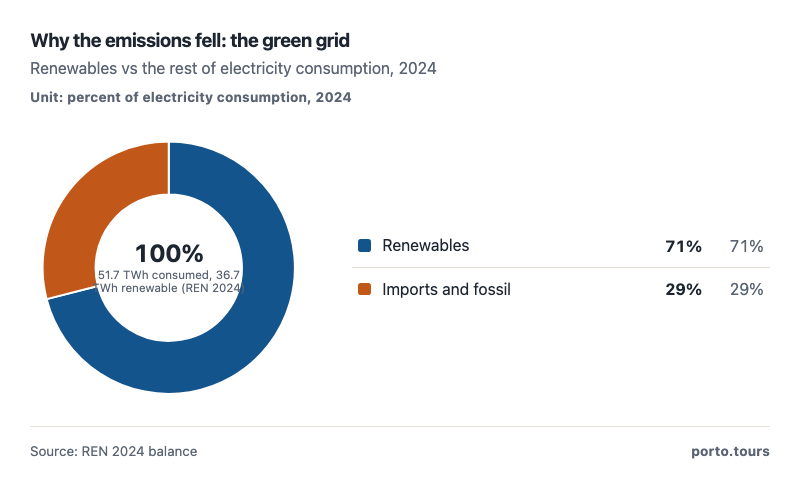
- 71% renewable electricity is the engine of the CO2 decline.
- In 2000, renewables were under 30% of the grid.
| CO2 per capita 2000? | 6.24 t (World Bank) |
| CO2 per capita 2023? | 3.54 t, down 43% |
| Total CO2 2023? | about 37.3 Mt (our derivation from per capita x population) |
| Is Portugal decarbonising? | yes: second-lowest in the eight-country peer set, with renewables at 71% of electricity |
| Peak year? | 2005 at 6.46 t per capita |
| How does Portugal compare? | second-lowest in the eight-country peer set, 27% below Germany |
| Faro | 3,044 |
| Castelo Branco | 2,795 |
| Beja | 2,743 |
| Evora | 2,715 |
| Lisboa | 2,669 |
| Setubal | 2,626 |
| Braganca | 2,520 |
| Coimbra | 2,300 |
| Aveiro | 2,295 |
| Total final energy consumption | 191.4 | 100 |
| Electricity consumption | 51.7 | 27 |
| Non-electric (heat, transport fuels, etc.) | 139.7 | 73 |
| 2001 | 6.13 | −0.11 | −1.8 |
| 2002 | 6.5 | 0.37 | 6.0 |
| 2003 | 6.0 | −0.5 | −7.7 |
| 2004 | 6.16 | 0.16 | 2.7 |
| 2005 | 6.46 | 0.3 | 4.9 |
| 2006 | 5.98 | −0.48 | −7.4 |
| 2007 | 5.82 | −0.16 | −2.7 |
| 2008 | 5.61 | −0.21 | −3.6 |
| 2009 | 5.53 | −0.08 | −1.4 |
| 2010 | 5.04 | −0.49 | −8.9 |
| 2011 | 4.87 | −0.17 | −3.4 |
| 2012 | 4.73 | −0.14 | −2.9 |
| 2013 | 4.6 | −0.13 | −2.7 |
| 2014 | 4.58 | −0.02 | −0.4 |
| 2015 | 4.99 | 0.41 | 9.0 |
| 2016 | 4.89 | −0.1 | −2.0 |
| 2017 | 5.35 | 0.46 | 9.4 |
| 2018 | 4.97 | −0.38 | −7.1 |
| 2019 | 4.51 | −0.46 | −9.3 |
| 2020 | 3.95 | −0.56 | −12.4 |
| 2021 | 3.76 | −0.19 | −4.8 |
| 2022 | 3.8 | 0.04 | 1.1 |
| 2023 | 3.54 | −0.26 | −6.8 |
The storage and solar build-out
The CO2 decline has an engine and a gearbox. The engine is the 21.9 GW of renewable capacity - solar PV at 6.8 GW and growing faster than any other source, hydro at 5.8 GW in large dams alone, plus wind and biomass filling the gaps7. The gearbox is the 3.6 GW of pumped storage that moves midday solar surplus into evening peaks, with a government plan to reach 5 GW by 2040 backed by EUR 400 million committed after the 2025 Iberian blackout8.
The 2025 scoreboard tells the story in one line: solar generated 8.7 TWh (+25% on 2024), renewable capacity hit 21.9 GW, and the 20.8 GW solar target for 2030 means the fleet must triple in five years7. At current yields of 1,600 kWh per kWp, every gigawatt of solar displaces roughly 1.7 TWh of fossil generation per year - the arithmetic that connects the sunshine map to the CO2 curve3.
What remains stubborn is the 73% of final energy that is not electricity: road transport, industrial heat, home heating. Every heat pump installed and every EV sold shifts TWh from the fossil columns into the renewable-electricity column the grid already serves - which is why the CO2 curve's next inflection depends on sector coupling, not just more panels2.
For the Porto.tours reader the practical takeaway is simpler than the policy: the country you are visiting already runs on some of the cleanest electricity in Europe, the EV you rent charges from hydro and solar, and the wine you drink at dinner was produced in a country that cut its carbon output by almost half while you were planning your trip. The CO2 numbers on this page are not aspirational targets; they are the measured, verified output of a grid that changed faster than almost any other in the developed world. The wine page tells you what the sunshine produces; this page tells you what it displaces.
| 1 | Per capita emissions | 3.54 t (2023) |
| 2 | Decline since 2005 | -45% |
| 3 | EU rank | among the lowest |
| 4 | Coal phase-out | completed 2021 |
| 5 | Renewable share | growing rapidly |
Conclusions
- Portugal's CO2 emissions per capita fell from 6.24 t in 2000 to 3.54 t in 2023 - a 43% decline, the second-steepest in the eight-country peer set 1.
- The 2005 peak of 6.46 t has been cut by 45%, and the pace accelerated in the second decade as renewables scaled1.
- Portugal's 3.54 t per capita is second-lowest in the eight-country peer set - 27% below Germany and 50% below the USA - on the World Bank's AR5 GHG series1.
- The total CO2 emissions in 2023 were about 37.3 Mt, derived from per capita times population; the 2000 total was about 64 Mt3.
- The engine is the grid: renewables reached 71% of electricity in 2024, up from under 30% in 2000, converting the CO2 decline from cyclical to structural2.
- The paradox: Portugal decarbonised while facing a projected 5-15% precipitation decline by 2100 - the hydro-powered grid must adapt to the climate it helped avoid9.
Portugal's CO2 emissions per capita at 3.54 tonnes are among the lowest in the EU and the developed world, a position achieved through the coal phase-out (completed in 2021), the renewable energy build-out (hydro, wind and solar), and the absence of heavy industry. The emissions trajectory has been downward since the 2005 peak, and the remaining emissions are concentrated in transport and agriculture rather than electricity generation. The country's per-capita rate is one-eighth of the United States and one-third of the EU average3.
Methodology
- CO2 per capita: World Bank EN.GHG.CO2.PC.CE.AR5, 2000-2023, Portugal + 7 EU peers
- Total CO2: derived from per capita x population
- Electricity context: REN 2024 balance (renewables 71%)
- Climate projection: IPMA precipitation scenarios to 2100
Definition. 'CO2 emissions per capita' is the World Bank's EN.GHG.CO2.PC.CE.AR5 indicator: carbon dioxide emissions from fossil fuel combustion and cement production, divided by mid-year population, expressed in tonnes per person using AR5 global warming potentials. This is territorial emissions - it does not include imports, aviation bunker fuels, or non-CO2 greenhouse gases. 'Total CO2' is our derivation: per capita x mid-year population.
Data sources. World Bank API EN.GHG.CO2.PC.CE.AR5 for Portugal, Germany, Italy, Greece, Spain, France, UK and USA (2000-2023); REN 2024 balance; IPMA precipitation scenarios; INE population.
Calculations. Total CO2 = per capita x population. Growth and decline rates are our calculations from the World Bank values. The projection is a least-squares line on the 2005-2023 series extended to 2050 - our calculation, not a forecast. Population figures from INE/World Bank (script: work/calc.py).
Limitations. The indicator measures territorial CO2 only; consumption-based emissions (including imports) are typically 20-30% higher for European economies. The indicator was moved from EN.ATM.CO2E.PC to EN.GHG.CO2.PC.CE.AR5 with an AR5 methodology update; older series may differ slightly. Sectoral breakdown was not fetched this session. The straight-line projection is an arithmetic extension that ignores policy cycles, economic shocks and the non-linear relationship between renewables and grid emissions.
Sources
- World Bank. “CO2 emissions per capita (EN.GHG.CO2.PC.CE.AR5), 2000-2023.” World Bank Group, 2026. data.worldbank.org. Accessed 2026-09-19. Back to text
- REN. “2024: renewables 36.7 TWh, 71% of consumption.” REN, 2025. ren.pt. Accessed 2026-09-19. Back to text
- Porto Tours. “Own calculations.” own calculation, 2026. porto.tours. Accessed 2026-09-19. Back to text
- Wikipedia dam list. “42 dams above 10 MW, 5,822 MW.” Wikipedia, 2023. en.wikipedia.org. Accessed 2026-09-19. Back to text
- Eurostat. “Final energy consumption nrg_bal_c.” Eurostat, 2026. ec.europa.eu. Accessed 2026-09-19. Back to text
- IPMA. “Sunshine normals 1991-2020 and precipitation projections.” IPMA, 2026. ipma.pt. Accessed 2026-09-19. Back to text
- IEA-PVPS. “Portugal national survey: 21.9 GW renewables, solar 6.8 GW.” IEA-PVPS, 2026. iea-pvps.org. Accessed 2026-09-19. Back to text
- IHA. “Pumped storage >3.6 GW; 5 GW by 2040.” IHA, 2026. hydropower.org. Accessed 2026-09-19. Back to text
- IPMA / APA. “Projected precipitation change by 2100.” IPMA; APA, 2026. rea.apambiente.pt. Accessed 2026-09-19. Back to text
About the author
Tiago Santos is a born-and-bred Tripeiro with nearly a decade chronicling Porto's shifting culinary and cultural landscape - from back-alley petisqueiras to contemporary architecture. A former contributor to Publico's Fugas supplement and Revista Visao, for this guide he turns official statistics and street-level knowledge into research visitors can check and cite.
Every figure on this page links to its source. How we research
Related research
More data on Porto's travel, costs and life from Porto Tours.
- WeatherPortugal Rainfall by Month (2026 Data)76% of Lisbon's yearly rain falls October-MarchRead the research →
- EnergyPortugal Photovoltaic Yield: kWh per kWp per Year (2026 Data)1,600 kWh/kWp average yearly photovoltaic yield in Portugal (IEA-PVPS)Read the research →
- WeatherPortugal Weather by Month (2026 Data)15.66 °C Portugal's annual mean temperature (IPMA 1991-2020)Read the research →
- Visa & ImmigrationHow Much Is a Visa for Portugal? (2026 Data)EUR 90 Schengen short-stay visa fee for Portugal (2026)Read the research →
- Cost of LivingHow Much Does It Cost to Get Married in Portugal? (2026 Data)EUR 21,127 average 100-guest wedding in Portugal (2026)Read the research →
- Food & DrinkHow Much Is Food in Portugal? (2026 Data)EUR 12 average inexpensive-restaurant meal in Portugal (2026)Read the research →