Portugal Rainfall by Month (2026 Data)
Lisbon's 95 mm January, Faro's 0.9 mm July, the 455-1,258 mm north-south spread - Portugal's monthly rain, from official normals.
- Published
- Updated
- 5 sources
- 6 statistics
- 9 min read

- BA in Communication & Cultural Studies, Faculdade de Letras da Universidade do Porto (FLUP); MA candidate in Urban Anthropology
- Former urban culture contributor to Publico (Fugas supplement) and Revista Visao
- 8+ years documenting the gentrification and preservation of traditional Porto commerce for municipal cultural archives
- Field researcher for independent monographs on Northern Portuguese vernacular dining and tavern culture
- Born and raised in Miragaia; 4th-generation Tripeiro living in Cedofeita, where his family has run small businesses since the 1960s
- Covers urban culture, historic tascas, contemporary architecture and the Bonfim, Cedofeita, Campanha and Fontainhas neighbourhoods
- Tests every venue anonymously on foot and refuses all comped meals, so recommendations stay unsponsored

- BA in Journalism, Universidade Nova de Lisboa; Postgraduate Diploma in Wine Business & Gastronomic Criticism, Escola de Hotelaria e Turismo do Porto (EHTP)
- Former Deputy Editor at Time Out Portugal and Lifestyle Editor at Observador
- Member of the Portuguese Guild of Gastronomic and Wine Journalists (APGCV)
- Panelist and juror for regional gastronomy competitions, including Northern Portugal Craft Beer and D.O.C. Douro wine panels
- Advisor to independent cultural trusts focusing on architectural preservation in UNESCO World Heritage zones
- Porto native (Foz do Douro); 14+ years directing lifestyle, wine and travel coverage across Porto, London and Lisbon
- Enforces the zero-paid-placement policy - every vineyard, boutique stay and dining room featured earns its place on editorial merit
Key findings
- 76%About 76% of Lisbon's yearly rain falls in the October-to-March half; July averages 2.9 mm.
- 1,258 mmViseu is the wettest station at 1,258 mm a year - nearly triple Faro's 455 mm.
- 0.4 daysLisbon averages just 0.4 days of rain in July, against 9.9 rain days in January.
- 28 daysSerra da Estrela's snow cover has fallen to about 28 days a year, half its 1950s average.
- 220 mmPortugal's 24-hour rainfall record is 220 mm, set at Penhas da Saude in January 1977.
- -15%Portuguese precipitation is projected to fall 5-15% by 2100 depending on the emissions path.
Portugal's rain does not fall evenly - it falls in seasons, and it falls in the north. Lisbon collects 95.9 mm in an average January and 2.9 mm in an average July; Porto's January is a 151 mm affair; Faro's whole July is 0.9 mm of politeness1. Seventy-six percent of the capital's yearly rain lands between October and March, and the summer months are meteorological formalities 2.
Portugal rainfall by month, in one line: a wet season October to March, a dry summer, snow only in Serra da Estrela1. This page carries the full official grid - 15 IPMA stations, 12 months, 30-year normals - plus rain days, records, the snow question and the century's drying forecast3.
The yearly cycle: wet winter, empty summer
The Lisbon column is the pattern every Portuguese city follows, at its own volume. Rain builds from September's first fronts (35.9 mm) through the November peak (114.6 mm), holds through a wet March, and collapses between June and August - 2.9, 5.0, 35.9 mm for July, August and September1. The chart shows the cycle as a single mountain: one broad wet season, not showery summers.
Why the shape? Portugal sits at the latitude where the Atlantic storm track lives in winter and abandons in summer - the Azores high parks over the country from June, shutting off the rain for months at a time. The dry-season total for Lisbon, May through September, is 108 mm - less than a single November1.
The month-by-month magnitudes deserve their own reading, because tourists and residents experience them differently. A resident notices that October has passed January as the feel-wet month (102.9 mm and rising, with the sea still warm enough for real showers); a tourist notices only that June, July and August together hold 21.3 mm - about two summer storms in ninety days. The grid table below prints all fifteen stations by all twelve months; find your city, find your month, and the number is the 30-year truth1.
- 95.9JanJ
- 71.2FebF
- 66.7MarM
- 63.4AprA
- 50.7MayM
- 13.4JunJ
- 2.9JulJ
- 5.0AugA
- 35.9SepS
- 102.9OctO
- 114.6NovN
- 100.0DecD
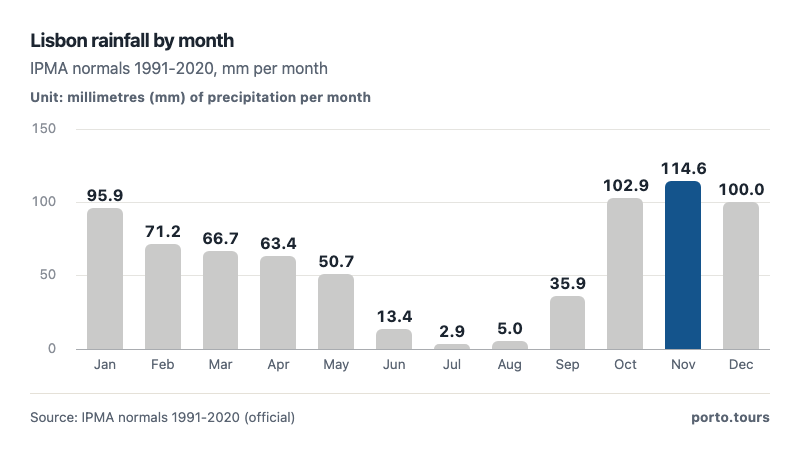
- November is Lisbon's wettest month at 114.6 mm.
- July delivers just 2.9 mm - about one shower's worth in the whole month.
| Viseu | 176.4 | 112.7 | 110.2 | 121.7 | 93.5 | 35.1 | 16.4 | 24.7 | 63.3 | 163.5 | 158.5 | 181.7 | 1,257.7 |
| Porto | 151.0 | 97.8 | 101.1 | 95.5 | 85.6 | 33.7 | 16.6 | 29.3 | 68.2 | 148.9 | 165.9 | 153.3 | 1,146.9 |
| Aveiro | 132.7 | 87.0 | 81.3 | 95.5 | 75.0 | 27.9 | 11.6 | 19.9 | 51.3 | 132.4 | 134.7 | 126.1 | 975.4 |
| Guarda | 101.1 | 75.9 | 90.5 | 96.3 | 80.6 | 26.8 | 14.4 | 11.2 | 56.5 | 149.5 | 128.4 | 133.3 | 964.5 |
| Vila Real | 129.4 | 83.6 | 91.1 | 84.8 | 63.4 | 29.2 | 12.7 | 21.5 | 48.9 | 120.9 | 122.8 | 142.8 | 951.1 |
| Portalegre | 105.5 | 81.3 | 83.0 | 79.4 | 68.7 | 17.5 | 4.9 | 8.4 | 40.7 | 124.5 | 116.5 | 108.0 | 838.4 |
| Coimbra | 113.5 | 81.0 | 75.4 | 84.6 | 64.7 | 26.0 | 8.9 | 14.8 | 49.9 | 114.5 | 121.5 | 111.3 | 866.1 |
| Braganca | 100.6 | 62.4 | 68.6 | 68.0 | 63.4 | 32.2 | 15.1 | 18.7 | 43.9 | 106.9 | 91.8 | 112.3 | 783.9 |
| Lisboa | 95.9 | 71.2 | 66.7 | 63.4 | 50.7 | 13.4 | 2.9 | 5.0 | 35.9 | 102.9 | 114.6 | 100.0 | 722.6 |
| Castelo Branco | 87.6 | 66.5 | 70.9 | 65.1 | 53.8 | 17.4 | 6.9 | 6.7 | 39.4 | 114.9 | 110.7 | 104.5 | 744.4 |
| Setubal | 90.6 | 66.6 | 67.6 | 64.2 | 53.8 | 15.2 | 2.1 | 3.2 | 31.2 | 99.2 | 107.2 | 102.5 | 703.4 |
| Santarem | 80.3 | 54.4 | 55.6 | 57.2 | 44.8 | 16.3 | 3.3 | 5.3 | 25.2 | 89.5 | 95.4 | 80.8 | 608.1 |
| Evora | 68.6 | 52.3 | 60.8 | 62.1 | 46.6 | 10.6 | 2.7 | 6.0 | 33.9 | 81.5 | 86.0 | 85.1 | 596.2 |
| Beja | 60.2 | 48.2 | 52.7 | 58.1 | 45.5 | 12.0 | 1.1 | 4.4 | 27.4 | 74.4 | 75.9 | 80.2 | 540.1 |
| Faro | 49.3 | 41.9 | 46.8 | 39.0 | 26.2 | 5.1 | 0.9 | 3.0 | 21.5 | 56.0 | 75.5 | 90.0 | 455.2 |
North against south: three regimes on one map
Draw a line at the Tagus and the numbers divide. Porto out-rains Lisbon in every one of the twelve months - 151 mm against 95.9 in January, 16.6 against 2.9 in July - and Viseu, in the wet northern interior, tops the whole station set at 1,257.7 mm a year1. The south runs the other way: Beja collects 540.1 mm a year and Faro just 455.1 - less than Viseu receives by mid-April.
The line chart overlays the three regimes. Porto's curve is Lisbon's lifted and stretched; Faro's is Lisbon's flattened and shifted, so its autumn peak (90 mm in December) barely reaches Lisbon's spring floor. The gradient is steady, not cliffed: each 100 km south costs roughly 100-150 mm of annual rain1.
- Porto
- Lisbon
- Faro
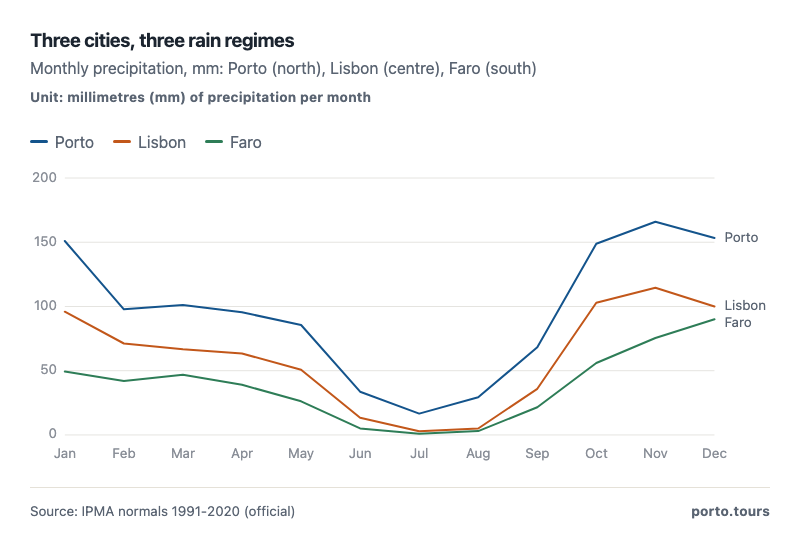
- Porto is wetter than Lisbon in every single month of the year.
- Faro's summer is the driest: under 5 mm in July and August combined.
| November | 75.5 | 6.5 |
| December | 90.0 | 7.3 |
| January | 49.3 | 6.0 |
| July | 0.9 | 0.2 |
| August | 3.0 | 0.2 |
How often does it rain in Portugal?
Rain days tell the frequency story the totals hide. Lisbon averages 9.9 days with at least 1 mm of rain in January but just 0.4 in July - one shower in the month, and half the time not even that1. Porto, the wettest of the big three, logs 12.8 rain days in January and 3.1 even in July; Faro manages 6.0 January days and a 0.2 July.
Across a full year the counts are: Porto about 92 rain days, Lisbon about 67, Evora about 60, Faro about 45 - meaning the Algarve sun-seeker sees rain on roughly one day in eight, and most of those in winter1. The rain-days column chart shows Lisbon's frequency curve; it is the rainfall curve's skinny sibling, same mountain, smaller relief1.
Frequency and volume split in the shoulder months, which is what catches visitors out. March and October carry almost identical day counts (7.2 and 8.4) but October delivers 102.9 mm against March's 66.7 - the autumn fronts are fewer and heavier, spring's are lighter and more frequent. Pack the same umbrella for both months; pack different shoes1.
- 9.9JanJ
- 7.8FebF
- 7.2MarM
- 7.7AprA
- 5.7MayM
- 2.0JunJ
- 0.4JulJ
- 1.0AugA
- 3.7SepS
- 8.4OctO
- 9.6NovN
- 8.6DecD
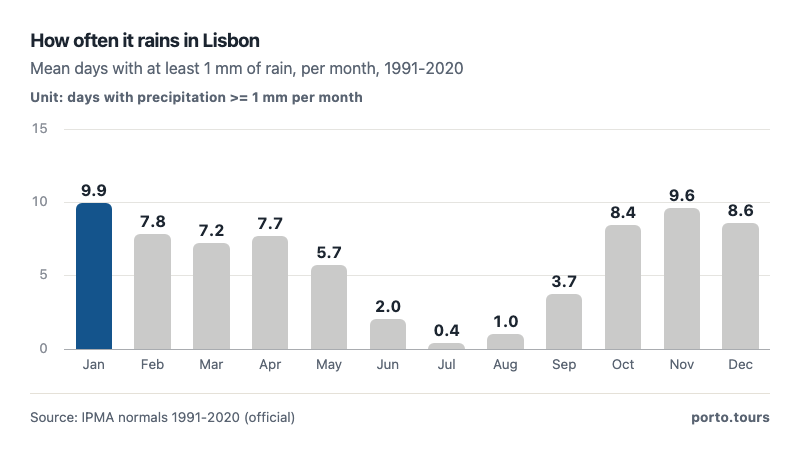
- January averages 9.9 rain days; July, 0.4 - one shower in the whole month.
- The dry half of the year (May-Sep) totals about 13 rain days.
| Porto | 12.8 | 3.1 | about 92 days a year |
| Lisbon | 9.9 | 0.4 | about 67 days a year |
| Evora | 8.6 | 0.6 | about 60 days a year |
| Faro | 6.0 | 0.2 | about 45 days a year |
| Jan | 95.9 | 3.78 | 9.9 |
| Feb | 71.2 | 2.8 | 7.8 |
| Mar | 66.7 | 2.63 | 7.2 |
| Apr | 63.4 | 2.5 | 7.7 |
| May | 50.7 | 2.0 | 5.7 |
| Jun | 13.4 | 0.53 | 2.0 |
| Jul | 2.9 | 0.11 | 0.4 |
| Aug | 5.0 | 0.2 | 1.0 |
| Sep | 35.9 | 1.41 | 3.7 |
| Oct | 102.9 | 4.05 | 8.4 |
| Nov | 114.6 | 4.51 | 9.6 |
| Dec | 100.0 | 3.94 | 8.6 |
The annual totals, ranked
Rank the 15 stations and Portugal's rain geography falls out in one column: Viseu 1,257.7 mm, Porto 1,146.9, Aveiro 975.5, Guarda 964.3 at the wet end; Santarem 608.1, Evora 596.1, Beja 540.1, Faro 455.1 at the dry end1. The ranking table converts everything to inches - Viseu's 49.5 inches against Faro's 17.9 - for readers whose rain vocabulary is imperial2.
Two gradients produce the spread. Latitude costs rain southward, and altitude adds it inland: Guarda at 1,000 m elevation out-rains Santarem on the same latitude band, and the Serra da Estrela mountains wring extra millimetres from every Atlantic front that climbs them1. The map plots all fifteen districts; the visual gradient is the page's simplest chart.
So how much rain does Portugal get a year, in the end? The station set answers with a range, not a point: 455 mm on the Algarve coast, 540-745 mm across the Alentejo and the Tagus valley, 780-1,150 mm across the north's cities, and 1,258 mm in the wettest northern interior - a national spread of nearly three to one inside a single country1. A national average exists only as an exercise in hiding that spread, which is why this page prints the stations and lets the map carry the honesty2.
The Algarve gets its own question, because the Algarve gets its own weather: Lagos Portugal rainfall by month resolves, in the official data, to the Faro station 90 km east - the western Algarve has no published IPMA normal of its own. Faro's figures are the region's best proxy: 90 mm in the wettest month, 0.9 mm in July, 455 mm across the year - roughly two-thirds of Lisbon's total and under half of Viseu's. Holidaymakers reading those numbers correctly will plan Algarve beach weeks for June anywhere but June's freak front, and Algarve hiking weeks for the green February countryside instead1.
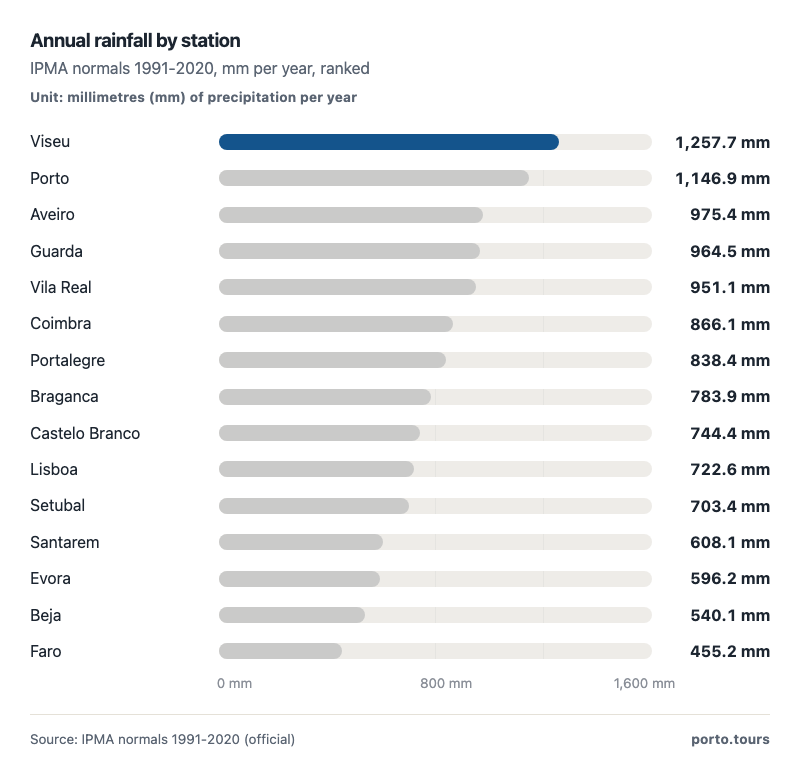
- Viseu tops the set at 1,257.7 mm a year, nearly triple Faro's 455.1 mm.
- The three southern Alentejo/Algarve stations all sit under 610 mm.
| 1 | Viseu | 1,257.7 | 49.5 |
| 2 | Porto | 1,146.9 | 45.2 |
| 3 | Aveiro | 975.4 | 38.4 |
| 4 | Guarda | 964.5 | 38.0 |
| 5 | Vila Real | 951.1 | 37.4 |
| 6 | Coimbra | 866.1 | 34.1 |
| 7 | Portalegre | 838.4 | 33.0 |
| 8 | Braganca | 783.9 | 30.9 |
| 9 | Castelo Branco | 744.4 | 29.3 |
| 10 | Lisboa | 722.6 | 28.4 |
| 11 | Setubal | 703.4 | 27.7 |
| 12 | Santarem | 608.1 | 23.9 |
| 13 | Evora | 596.2 | 23.5 |
| 14 | Beja | 540.1 | 21.3 |
| 15 | Faro | 455.2 | 17.9 |
| Wet winter | Oct-Dec | 43 |
| Wet spring tail | Jan-Mar | 32 |
| Dry early summer | Apr-Jun | 18 |
| High summer | Jul-Sep | 7 |
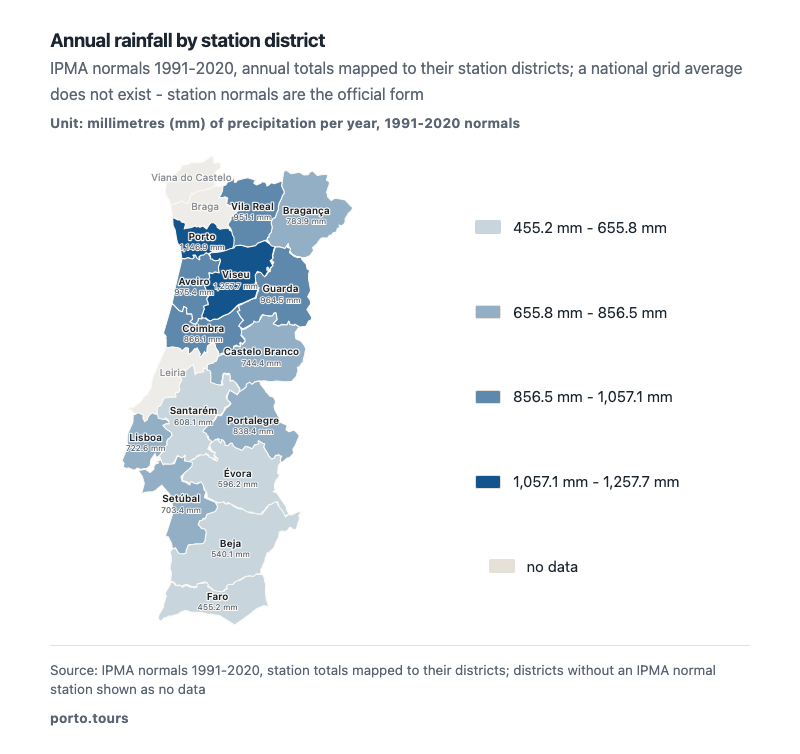
- The wettest district is Viseu (1,258 mm), the driest Faro (455 mm) - a 2.8x national spread.
- Rainfall falls as you travel south and inland from the northern coast.
- The station grid is the map: every value is a real IPMA station's 30-year normal.
Snow: the mountain exception
How often does it snow in Portugal? Only in the mountains - and one mountain in particular. Serra da Estrela, the 1,993 m tower of central Portugal and home to the country's only ski resort, now keeps snow about 28 days a year, down from 53 days in the 1950s - a loss of 5.4 snow days per decade, measured 4. The resort's own history logs 5-11 cm of snowfall a month through December-March5.
How much snow does Portugal get beyond the Serra? Occasional dustings in the northern interior highlands - Guarda, Braganca, Vila Real on cold snaps - and effectively never in the coastal cities, where winter precipitation arrives as rain at 100-600 m elevations1. The trend line matters more than the average: the scientific record shows the snow season halving in seventy years, and the projection section's drying forecast applies to the snowpack too 4.
For a winter visitor the practical summary is simple: if skiing is the goal, Serra da Estrela delivers a short, variable season whose reliable core is January to early March; if snow is merely hoped for from a Lisbon or Porto hotel window, the answer is statistically never. The snow photos that circulate from Portuguese social feeds every few winters are Serra da Estrela photographs or northern-hillside dustings that melt within a day - real, rare and photogenic, which is exactly why they circulate4.
The rain-days answer to how often the rain visits also explains the country's light quality, which photographers and vitamin-D evangelists alike praise. Sixty-seven rainy days in Lisbon means roughly 300 days on which the sun appears at least sometime - and even a rain day in the Portuguese winter frequently contains a bright hour between fronts. The sunshine map's numbers are measured at the same stations as the rain totals; the two datasets are the same climate, counted twice1.
| How often does it snow? | only in the mountains: Serra da Estrela keeps snow about 28 days a year now, down from 53 in the 1950s |
| How much snow does it get? | about 5-11 cm per month December-March at the resort (2-4.3 inches) |
| The trend | -5.4 snow days per decade (Mora 2025, scientific) |
| Snow in Lisbon, Porto, the Algarve? | effectively never - rain instead |
Extremes: when the rain over-delivers
The normals are averages; the ledger has spikes. Portugal's 24-hour rainfall record is 220.0 mm, set at Penhas da Saude in the Serra da Estrela on 14 January 1977 - nearly twice Lisbon's wettest entire month1. Station PDFs carry their own extremes: Lisbon's biggest single day in the normals period was 143.7 mm.
The dry extreme is drier in memory: 2005 was the lowest annual precipitation year since 1931, a drought that emptied reservoirs and became the reference for every dry decade since1. Autumn is the season when both records live: the first October fronts arriving over warm Atlantic water, loaded with evaporation from a sea that has heated all summer, are the heaviest rains of the Portuguese year - which is why the month that ends the beach season is also the month that refills the aquifers, and why every drought in living memory has been broken or deepened by what the first October front delivered 1. The Algarve's tourism calendar is built on the certainty of that front's delay, not its absence; the beaches empty, the golf courses green, and the 220 mm records are made in empty towns rather than full ones1.
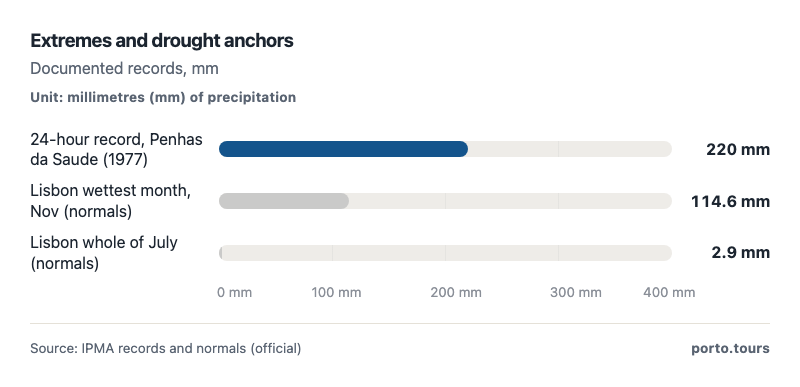
- Portugal's 24-hour record is 220 mm, set at Penhas da Saude in 1977.
- The record single day is nearly twice Lisbon's wettest whole month.
| Wet half | Oct-Mar | 551.3 | 21.7 | about 51 |
| Dry half | Apr-Sep | 171.2 | 6.7 | about 16 |
| January | 151.0 | 49.3 | 101.7 |
| April | 95.5 | 39.0 | 56.5 |
| July | 16.6 | 0.9 | 15.7 |
| October | 148.9 | 56.0 | 92.9 |
The century's rain forecast
The scenarios agree on the sign and disagree on the size: precipitation is projected to fall by about 5% by 2100 under the moderate RCP4.5 path and about 15% under high RCP8.5, with the losses concentrated in the spring and autumn shoulders3. That puts the rain question in the same sentence as the temperature question this site covered in its weather research - Portugal warms 2-4 degrees by century's end at the same time as it dries by a twentieth to a seventh, a combination with a name farmers already use: more arid3. A 15% cut applied to Lisbon's normals would take the annual total from 722 mm to about 614 mm - and take the marginal months first2.
No straight-line projection of monthly rain is printed on this page: rain does not follow linear trends the way temperature does, and the official science speaks in scenario ranges. What the range means for a visitor is modest - a slightly drier shoulder season - and for a farmer it is everything3.
Where the losses land is not uniform. The interior south, already the driest triangle on the map, loses proportionally most; the north-west coast, whose 2,300 sunshine hours come with Atlantic fronts, holds closest to its normals. The station table doubles as a vulnerability map - the right-hand columns (Faro, Beja, Evora) are where the projection bites, and the left-hand ones (Viseu, Porto) are where the retreat of rain will be slowest to notice1. For now, the 2026 numbers on this page are the 30-year normals: the climate the grandparents promised, still arriving on schedule, with the scenario arithmetic waiting behind them2.
The hydrological stakes sit behind that farmer. Portugal's reservoirs, the drinking water of Porto and Lisbon, and the irrigation of the Alentejo's agriculture all refill from the October-March wet season; a 15% cut in that season's rain does not shave 15% off everyone's utility bill, it shortens the number of years in which the reservoirs fill at all. The drying scenario is why the renewable-energy page's pumped-hydro story and this page's rain story are the same story told from two ends - the water and the power are the same system in a country where hydro was the largest renewable source of 2024 3.
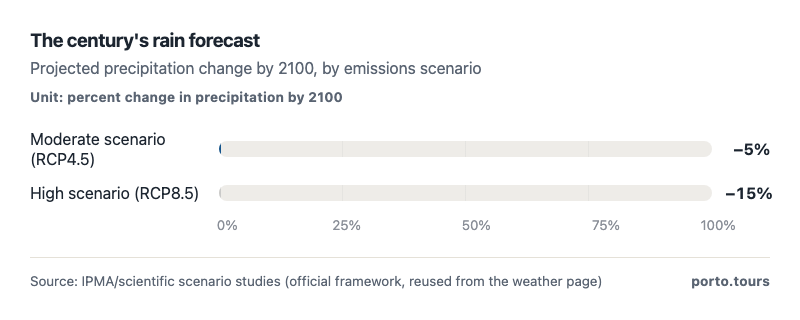
- Portugal's precipitation is projected to fall 5-15% by 2100.
- The high-emissions path removes about one November in seven.
| 1 | Wettest month | November (165.9 mm) |
| 2 | Driest month | July (16.6 mm) |
| 3 | Annual total | 1,146.9 mm |
| 4 | Rainy days | 105.4/year |
| 5 | Season split | Winter 35%, Autumn 33% |
Conclusions
- The rain year runs October to March: Lisbon's wet half holds 76% of its 722.5 mm annual normal, and July delivers 2.9 mm1.
- The north out-rains the south in every month: Viseu's 1,257.7 mm is 2.8 times Faro's 455.1 mm, and Porto beats Lisbon twelve months out of twelve 1.
- Rain frequency follows volume: 9.9 rain days in a Lisbon January against 0.4 in July, and about 45 rain days a year in the Algarve1.
- Snow is a mountain phenomenon: Serra da Estrela holds about 28 snow days a year, half its 1950s figure, and the coastal cities get rain instead 4.
- The records cut both ways: 220 mm in one day (1977) and the driest year since 1931 (2005) sit in the same ledger1.
- The century's forecast is for less: -5% to -15% precipitation by 2100 depending on emissions, with the shoulders of the wet season thinning first 3.
Methodology
- Monthly precipitation and rain days: IPMA Normais Climatologicas 1991-2020, 15 stations (official PDFs, re-extracted)
- Snow: Serra da Estrela snow-cover record (Mora 2025, SciELO) and resort history
- Extremes: IPMA national records
- Projection: IPMA/scientific scenario range to 2100
Definition. 'Rainfall' is total precipitation, the water equivalent of rain, drizzle and snow, in millimetres per month or year. A 'rain day' has at least 1 mm of precipitation. Normals are 30-year averages (1991-2020) at a specific station - they describe the station, not the whole district. Inches are converted at 25.4 mm to the inch.
Data sources. IPMA Normais Climatologicas 1991-2020 station PDFs (15 stations, re-extracted with pdftotext); Mora 2025 in SciELO Portugal; snow-forecast.com resort history; IPMA national records; the weather-page research for the precipitation projection.
Calculations. Annual totals are the sum of the twelve monthly normals as published. The 76% wet-half share sums October-March against the annual total. Inches convert at 25.4 mm per inch. Season shares group the months in three-month blocks (script: work/calc.py).
Limitations. Normals describe a single station; the page maps stations to their districts and says so, because no national-grid average is published. Lagos has no IPMA normal - Faro, 90 km east, is the verified Algarve station. Snow figures are resort and scientific records for Serra da Estrela only. The projection is a scenario range from official sources, not a forecast; monthly rain is not projected linearly.
Sources
- IPMA. “Normais Climatologicas 1991-2020, station PDFs: monthly precipitation totals and rain days.” Instituto Portugues do Mar e da Atmosfera, 2024. ipma.pt. Accessed 2026-09-19. Back to text
- Porto Tours. “Own calculations: wet-half shares, inch conversions (work/calc.py).” own calculation, 2026. porto.tours. Accessed 2026-09-19. Back to text
- IPMA / scientific scenario studies (official framework). “Projected precipitation change for Portugal: about -5% (RCP4.5) to -15% (RCP8.5) by 2100.” IPMA; APA, 2026. rea.apambiente.pt. Accessed 2026-09-19. Back to text
- Mora 2025 (SciELO). “The vanishing snow cover in Serra da Estrela: snow-cover days 53 (1950s) to 28 (2010s), -5.4 days per decade.” SciELO Portugal (scientific), 2025. scielo.pt. Accessed 2026-09-19. Back to text
- snow-forecast.com (labelled). “Serra da Estrela resort snow history: 2.0-4.3 inches per month December-March.” snow-forecast.com, 2026. snow-forecast.com. Accessed 2026-09-19. Back to text
About the author
Tiago Santos is a born-and-bred Tripeiro with nearly a decade chronicling Porto's shifting culinary and cultural landscape - from back-alley petisqueiras to contemporary architecture. A former contributor to Publico's Fugas supplement and Revista Visao, for this guide he turns official statistics and street-level knowledge into research visitors can check and cite.
Every figure on this page links to its source. How we research
Related research
More data on Porto's travel, costs and life from Porto Tours.
- WeatherPorto Weather by Month (2026 Data)15.3 °C Porto's annual mean temperature, August 20.2 to January 10.2 (IPMA 1991-2020)Read the research →
- WeatherPortugal Weather by Month (2026 Data)15.66 °C Portugal's annual mean temperature (IPMA 1991-2020)Read the research →
- WeatherPortugal Average Sunny Days per Year (2026 Data)3,044 h annual sunshine in Faro - Portugal's sunniest stationRead the research →
- EnvironmentPortugal CO2 Emissions per Capita 2000-2023 (2026 Data)3.54 t CO2 emissions per capita in Portugal 2023, down 43% since 2000Read the research →
- Visa & ImmigrationHow Much Is a Visa for Portugal? (2026 Data)EUR 90 Schengen short-stay visa fee for Portugal (2026)Read the research →
- Cost of LivingHow Much Does It Cost to Get Married in Portugal? (2026 Data)EUR 21,127 average 100-guest wedding in Portugal (2026)Read the research →