Portugal Photovoltaic Yield: kWh per kWp per Year (2026 Data)
About 1,600 kWh per kWp a year, 21.9 GW of renewables and a 71% green grid - Portugal's solar and hydro machine, verified.
- Published
- Updated
- 7 sources
- 6 statistics
- 9 min read

- BA in Communication & Cultural Studies, Faculdade de Letras da Universidade do Porto (FLUP); MA candidate in Urban Anthropology
- Former urban culture contributor to Publico (Fugas supplement) and Revista Visao
- 8+ years documenting the gentrification and preservation of traditional Porto commerce for municipal cultural archives
- Field researcher for independent monographs on Northern Portuguese vernacular dining and tavern culture
- Born and raised in Miragaia; 4th-generation Tripeiro living in Cedofeita, where his family has run small businesses since the 1960s
- Covers urban culture, historic tascas, contemporary architecture and the Bonfim, Cedofeita, Campanha and Fontainhas neighbourhoods
- Tests every venue anonymously on foot and refuses all comped meals, so recommendations stay unsponsored

- BA in Journalism, Universidade Nova de Lisboa; Postgraduate Diploma in Wine Business & Gastronomic Criticism, Escola de Hotelaria e Turismo do Porto (EHTP)
- Former Deputy Editor at Time Out Portugal and Lifestyle Editor at Observador
- Member of the Portuguese Guild of Gastronomic and Wine Journalists (APGCV)
- Panelist and juror for regional gastronomy competitions, including Northern Portugal Craft Beer and D.O.C. Douro wine panels
- Advisor to independent cultural trusts focusing on architectural preservation in UNESCO World Heritage zones
- Porto native (Foz do Douro); 14+ years directing lifestyle, wine and travel coverage across Porto, London and Lisbon
- Enforces the zero-paid-placement policy - every vineyard, boutique stay and dining room featured earns its place on editorial merit
Key findings
- 1,600 kWhPortugal's average photovoltaic yield is about 1,600 kWh per installed kWp per year, ranging 1,200-1,800 by region.
- 21.9 GWPortugal's renewable capacity reached about 21.9 GW by the end of 2025, led by hydro and wind.
- 6.8 GWSolar PV capacity reached 6.8 GW in 2025; the 2030 target is 20.8 GW.
- 71%Renewables supplied 71% of Portugal's electricity in 2024, a record 36.7 TWh.
- 191.4 TWhPortugal's final energy consumption in 2024 was 191.4 TWh, still below its 2010 level of 200.8.
- 3.6 GWPortugal operates more than 3.6 GW of pumped-storage hydropower, Europe's battery strategy in miniature.
Point a kilowatt of solar panels at Portuguese sunshine and it repays you with about 1,600 kilowatt-hours a year - the national average photovoltaic yield is 1,600 kWh per kWp on IEA-PVPS's official survey, stretching from 1,200 in the cloudy north-west to over 1,800 in the Alentejo and Algarve1. That single number is why Portugal plans to triple its solar fleet by 2030, why pumped hydro holds the batteries, and why 71% of everything the country consumed in 2024 was renewable2.
So this page answers the yield question first - then prices the machine behind it: the hydro and solar capacity in gigawatts, the 191.4 TWh total energy appetite, the record 71% renewable share, and the sunshine map that explains every regional difference3.
Portugal photovoltaic yield: kWh per kWp per year
The direct answer: Portugal's average photovoltaic yield is about 1,600 kWh per installed kWp per year, on the IEA-PVPS national survey - the International Energy Agency's own research programme1. The verified range around that average is wide, from 1,200 kWh/kWp in the Minho's cloudy corners to more than 1,800 in the Alentejo and Algarve south, and a Lisbon rooftop models out at about 1,578 kWh/kWp - within a whisker of the national figure, which surprises visitors who expect the capital to be the sunniest spot 4.
The 1,300 figure that older searches keep finding is not wrong - it is the conservative floor, the number a badly tilted, shaded, soiled installation delivers. A modern, well-sited array beats it by a third, and the yield table keeps every anchor visible: the average, the Lisbon model, the floor and the south's 1,8004. The sibling query Portugal solar pv yield kWh per kWp per year resolves to the same numbers - solar PV is the technology the 1,600 describes - and it is worth pinning the vocabulary: kWp measures the array's peak nameplate, the kWh are what a year of Portuguese sky actually delivers through it1. Multiply for the wallet: one kWp at the national average produces about EUR 276 of power a year at 2025 household tariffs, so a typical 5 kWp terrace system offsets roughly EUR 1,380 of electricity annually5.
Yield vocabulary, one paragraph, because the searches mix three terms. Specific yield - the kWh per kWp this page leads with - measures annual production per installed kilowatt-peak. Irradiance measures the sun itself, in kilowatt-hours per square metre, and Portugal receives between about 1,500 and 1,800 of those hours-equivalents depending on whom you ask; the two numbers are related by the panel's efficiency, which is why the same sun yields less through an old panel4. And performance ratio - the installer's term - is the share of the theoretical yield a real system keeps, typically 80-90% when clean and unshaded. The 1,600 average already assumes that real-world haircut1.
Orientation closes the practical file: south-facing at roughly 30-35 degrees is the textbook optimum, but east-west splits lose only about a tenth and double the morning-evening coverage - relevant in Porto's valley streets and Lisbon's east-west avenues alike. The atlas tools let a reader drop a pin on their own roof; the national numbers on this page are the benchmark to compare against 4.
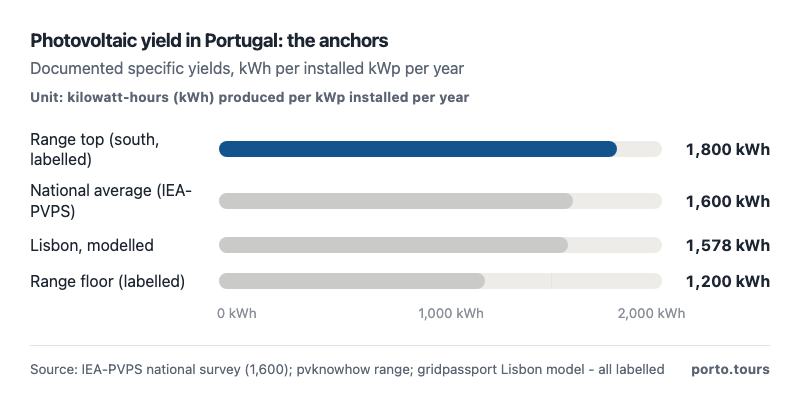
- The national average is about 1,600 kWh per installed kWp a year.
- The verified range runs from 1,200 in the north to over 1,800 in the sunny south.
| National average | 1,600 | IEA-PVPS national survey (official programme) |
| Lisbon, modelled | 1,578 | gridpassport model (labelled) |
| Range floor | 1,200 | pvknowhow country report (labelled) |
| Range top | 1,800 | pvknowhow country report (labelled) |
| Conservative floor of older searches | 1,300 | the figure behind the 1,300 query variant |
| Yield, national average | 1,600 kWh per kWp a year |
| Typical residential system, 5 kWp | about 8,000 kWh a year |
| Value at the 2025 household tariff (EUR 0.1722/kWh) | about EUR 276 per kWp a year |
| Scale note | 10 kWp produces about 16 MWh - more than a small apartment consumes |
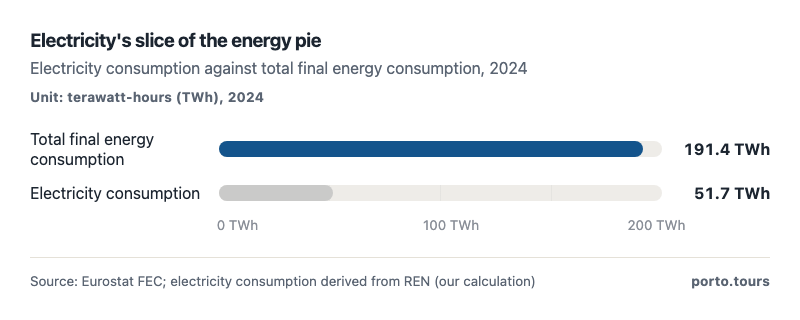
- Electricity is about 51.7 TWh of the 191.4 TWh final bill - 27%.
- Every electrified heater or EV moves TWh from fossil columns into the solar-and-hydro column.
The resource behind the yield
Yield is sunshine converted through hardware, and the sunshine is measured: the map plots IPMA's district normals, the same official series this site used for its sunny-days research3. Faro's 3,044 hours a year is the national ceiling; the interior south - Beja, Evora, Castelo Branco - all clear 2,700; and the Atlantic north-west, from Porto through Aveiro and Coimbra, sits near 2,300 hours3.
That north-south gradient of roughly 750 hours is the physical reason the specific yield spans 1,200-1,800, and why the utility-scale parks concentrate where the map turns gold: the Alentejo alone hosts more than a third of Portugal's solar generation1. The MDPI review of PV siting reaches the same conclusion from the irradiance data - the Algarve and Alentejo combine high sunlight with the country's steadiest skies, the low year-to-year variability that makes a park's output bankable4.
The seasonal shape matters as much as the annual total. Portuguese sunshine concentrates where the demand is not: summer afternoons produce the surpluses that the grid exports or stores, while December delivers roughly a third of July's hours in the north. A rooftop sized for winter consumption will overshoot in summer, which is why the grid-export tariff, not the winter deficit, decides most payback calculations in the south5.
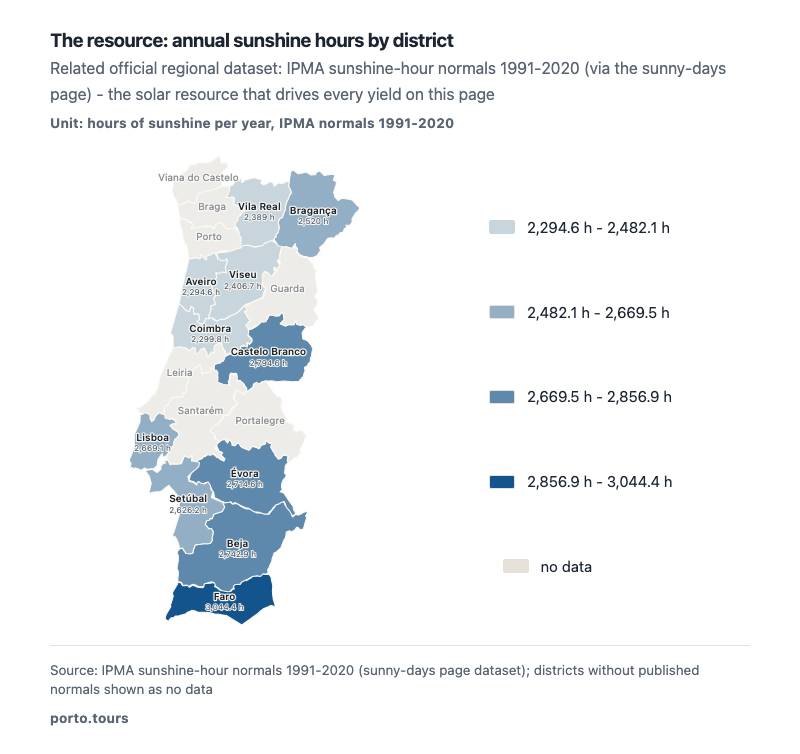
- Faro leads with 3,044 sunshine hours a year - the Algarve's yield advantage is measured in hours.
- The interior south (Beja, Evora, Castelo Branco) all clear 2,700 hours.
- The cloudy north-west (Aveiro, Coimbra, about 2,300) still outruns Germany's solar belt.
Hydro: the old giant that stores the new sun
The direct answer to Portugal total hydropower capacity GW 2024 is a pair of verified pieces rather than one clean number: 42 large dams above 10 MW hold 5,822 MW and average 12,997 GWh a year, and pumped storage alone exceeds 3.6 GW of that total - while the whole renewable fleet they anchor reached 21.9 GW by the end of 20254. REN's fuller hydro count adds the small stations, and the small-hydro capacity question - Portugal small hydropower total capacity mw - lands inside that same fuller register, which is not extractable as a single clean table; the page flags it rather than guessing4.
Hydro's modern role is no longer bulk energy - it is storage. The IHA counts Portugal's operating pumped fleet at more than 3.6 GW, with a government plan backing 5 GW by 2040 and EUR 400 million committed after the 2025 Iberian blackout; the Tamega complex alone is one of Europe's largest storage sites 7. Water is how Portugal makes solar power available at dinner time, and the 2024 balance proved the design: hydropower was the largest renewable contributor of the year2.
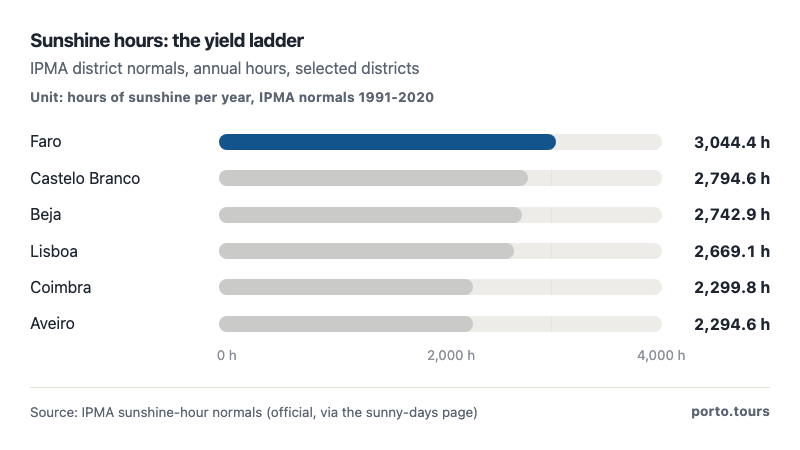
- Faro's 3,044 sunshine hours top the table by more than 250 hours.
- Even the cloudiest flagged districts hold about 2,300 hours a year.
| All renewables, end-2025 | 21.9 | IEA-PVPS total |
| Solar PV, end-2025 | 6.8 | +1 GW added during 2025 |
| Large dams, above 10 MW (2023) | 5.82 | 42 plants; small hydro adds more |
| Pumped storage, operating | 3.6 | a subset of the hydro fleet |
| Large dams (above 10 MW) | 42 plants, 5,822 MW |
| Average annual hydro production of those dams | 12,997 GWh |
| Pumped storage operating | more than 3.6 GW |
| Pumped storage plan | 5 GW by 2040, EUR 400M committed |
| Hydropower in 2024 | the largest renewable contributor |
Solar's climb and the 2030 target
The 2025 scoreboard: 6.8 GW of solar installed, more than 1 GW added in a single year, 8.7 TWh generated - a 25% jump - and third place among the renewables behind hydro and wind1. The National Energy and Climate Plan commits to 20.8 GW AC of solar by 2030, about three times today's fleet, with solar named the principal contributor of new capacity1. Wind, the mature sibling, added just 64 MW in 2024 - the growth race has a winner, and it is the technology whose yield this page opened with1.
At 8.7 TWh, solar already powers roughly one kWh in six of Portuguese consumption, and every additional gigawatt adds about 1.7 TWh at these yields5. That is the arithmetic behind the 20.8 GW target: it implies about 35 TWh of solar generation by 2030 if the sun cooperates - more than half of everything the country consumed in 20245.
The growth has a geography, visible on the sunshine map below: the Alentejo's plains host more than a third of the solar generation, the Algarve follows the same sun, and the parks queue for grid connections along the 500 kV lines that carry it to the coast. The 2025 Iberian blackout gave this build-out a new argument - inverter-based generation must now prove it can keep the lights on in a voltage stumble, and the grid code that follows will shape which of the 20.8 target GW get built first1.
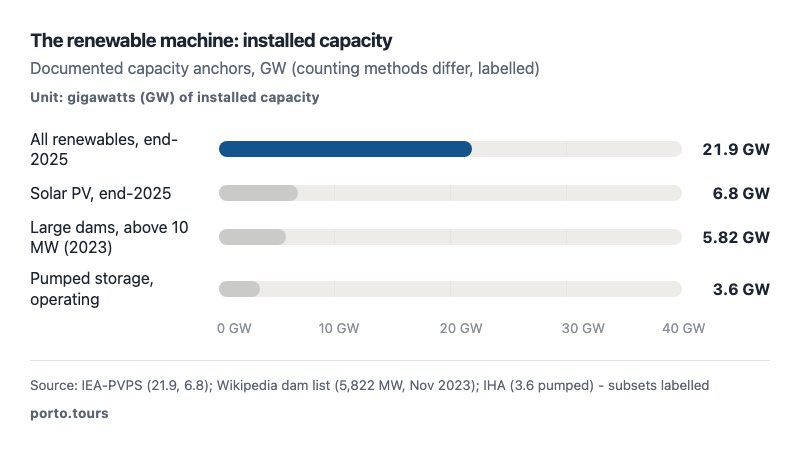
- Portugal's renewable fleet reached about 21.9 GW by the end of 2025.
- Solar PV at 6.8 GW is the fastest-growing piece of the machine.
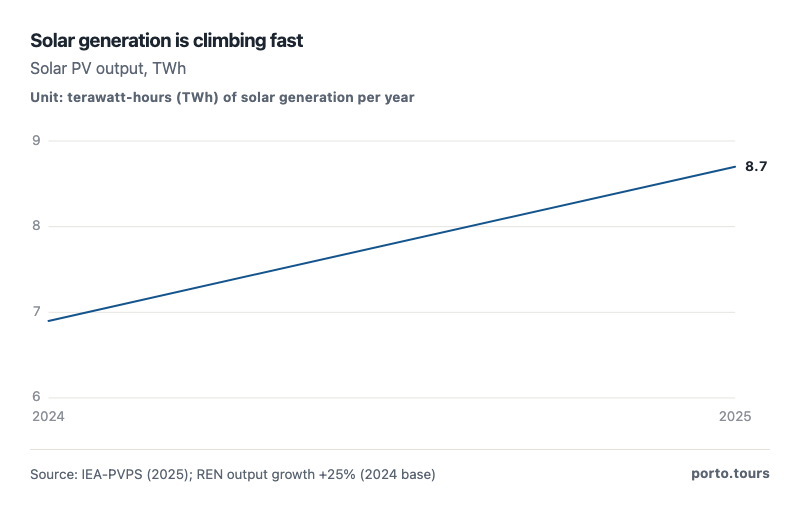
- Solar produced about 8.7 TWh in 2025, a 25% jump on the year.
- It is now Portugal's third-largest renewable source, after hydro and wind.
| Installed capacity, end-2025 | 6.8 GW (+1 GW in the year) |
| Generation, 2025 | about 8.7 TWh, +25% on 2024 |
| Rank among renewables | third, after hydro and wind |
| NECP 2030 target | 20.8 GW AC - about three times today |
| Regional centre of gravity | Alentejo, more than a third of generation |
Portugal total final energy consumption in TWh
How much is Portugal total final energy consumption twh, all fuels and all uses? Eurostat's balance answers year by year: 191.4 TWh in 2024, down from 200.8 in 2010 and up from the 173.4 austerity trough of 20136. The fifteen-year shape is the country's economic biography - crisis collapse, recovery, pandemic dip, and a plateau just above 190 since 20226.
Electricity is only 27% of that final bill - 51.7 TWh of the 191.4 - which is the quiet argument of the whole renewable strategy: the 71% green share of the grid still leaves transport fuels, industrial heat and home heating as mostly fossil territory5. Every heat pump installed and every EV sold converts part of the 140 non-electric TWh into the solar-and-hydro column this page opened with6. The projection on the chart is our straight line, not a forecast; a decarbonising economy can bend it downward5.
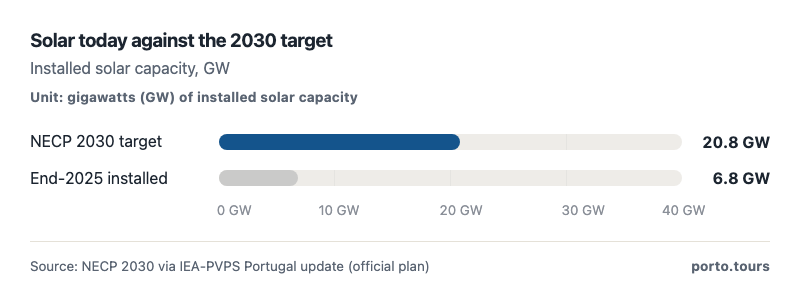
- Portugal plans 20.8 GW of solar by 2030 - three times today's fleet.
- The plan makes solar the main contributor of new renewable capacity.
- Renewables71%71%
- Imports and fossil29%29%
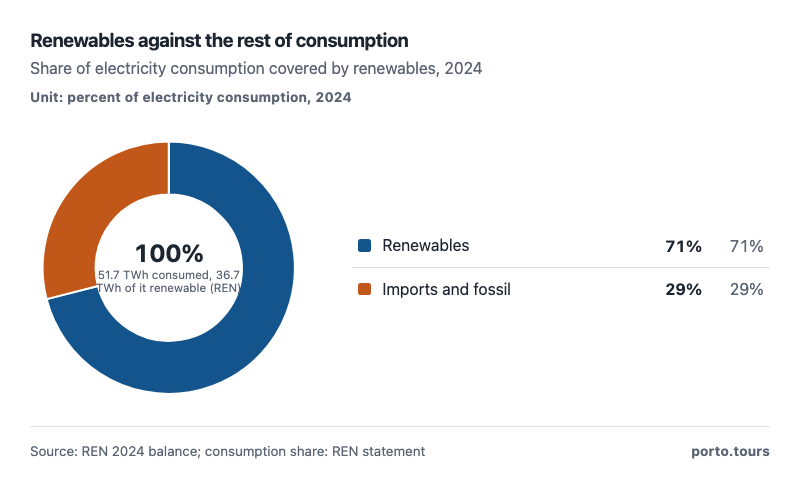
- Renewables covered 71% of consumption in 2024, a record.
- In 2025 the share settled at 68% as demand hit new peaks.
| 2010 | 200.8 | 2018 | 187.9 |
| 2011 | 191.2 | 2019 | 190.2 |
| 2012 | 175.7 | 2020 | 176.3 |
| 2013 | 173.4 | 2021 | 183.4 |
| 2014 | 178.9 | 2022 | 188.1 |
| 2015 | 180.9 | 2023 | 191.5 |
| 2016 | 181.9 | 2024 | 191.4 |
| 2017 | 184.9 | 0 |
The renewable share of consumption
The share donut carries the headline the sector quotes: renewables covered 71% of Portugal's electricity consumption in 2024, a record 36.7 TWh, with imports and fossil generation splitting the rest2. In 2025 the share eased to 68% as consumption set records - peak demand crossed 10 GW for the first time in January 2026 - even though renewable output itself rose to about 37 TWh2.
Read together with the final-energy chart, the donut explains Portugal's position precisely: a grid that is already most of the way decarbonised on electricity, attached to an economy whose larger final-energy bill - the other 140-odd TWh - is the next frontier the 2030 targets aim at6. The 68%-71% band is not a plateau; it is a floor the storage build-out is designed to raise7.
For the reader calibrating: 36.7 renewable TWh against a 191.4 TWh final-energy bill means the electricity triumph covers about a fifth of the country's real energy appetite. The gap is road fuel, industrial heat and heating oil - the columns that electrification strategies promise to shrink. Every percentage point of the transport and heating shift converts fossil TWh into the electricity TWh that this page's solar and hydro charts describe, which is why the 2030 targets speak in GW of panels and GW of batteries rather than in litres of diesel avoided6.
Projection: linear trend of 2005–2024 yearly values, 95% prediction range. Our calculation, not a forecast.
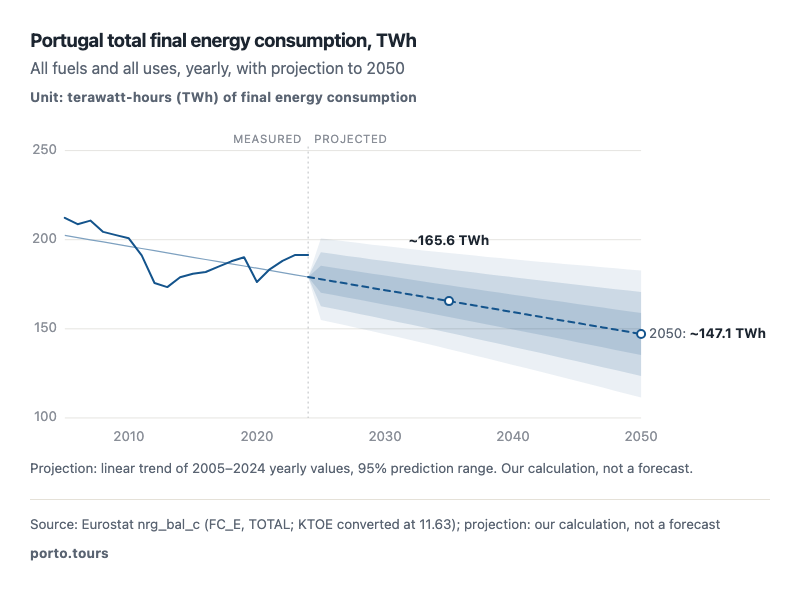
- Final consumption fell to a 173.4 TWh trough in 2013, then recovered to 191.4 by 2024.
- The 2024 figure is still below the 200.8 TWh of 2010 - efficiency ate the growth.
| 2023 | 37.2 | 71 |
| 2024 | 36.7 | 71 |
| 2025 | 37.0 | 68 |
Storage and the records
The storage fleet is the corridor between solar's midday surplus and the evening peak that crossed 10 GW for the first time in January 20262. Portugal operates more than 3.6 GW of pumped storage today, has committed EUR 400 million to the build-out, and plans 5 GW by 2040 - the Tamega complex in the north alone ranks among Europe's largest batteries7. The record books of 2024-2026 are all storage-shaped: record renewable output (36.7 TWh), record imports used as virtual storage (10.5 TWh), record peak demand, and pumped-storage generation setting its own record2.
The 2025 blackout is the reason the storage story accelerated. A voltage oscillation in April 2025 dropped the Iberian peninsula for half a day, and the government's answer was the EUR 400 million storage programme and the 5 GW pumped-hydro target - a bet that water in mountains is the cheapest way to hold sunshine for later. The pumped fleet's round-trip efficiency of roughly 75-80% means a quarter of the pumping energy is the toll for firmness, a cost the system pays for the 2 h 50 Alfa Pendular and the dinner-time solar alike 7.
For the rooftop owner the storage question is smaller and personal: a 1,600 kWh/kWp yield means a 5 kWp array fills a household's days and exports the spring surplus; the payback maths belong to the tariff, not the sun 5. The utilities page carries that tariff story; this page supplies the sun.
| ...1,300 kWh/kWp? | the conservative floor; the verified range is 1,200-1,800+ with 1,600 the average |
| ...small hydropower capacity? | the verified list covers dams above 10 MW (5,822 MW across 42 plants); small hydro adds more on REN's fuller count |
| ...total hydropower capacity 2024? | no single extractable official total; the verified pieces are the dam list, the 3.6 GW pumped fleet and the 21.9 GW renewables total |
| ...final consumption 2022 vs 2023? | 188.1 TWh in 2022 and 191.5 TWh in 2023 |
Conclusions
- Portugal's average photovoltaic yield is about 1,600 kWh per kWp a year - 1,200 to over 1,800 by region - on the IEA-PVPS official survey1.
- The renewable fleet reached 21.9 GW by the end of 2025, with solar at 6.8 GW growing faster than everything else and hydro's 5.8 GW of large dams doing the storage work1.
- Renewables covered a record 71% of electricity consumption in 2024 and held 68% in 2025 as demand crossed a 10 GW peak for the first time2.
- Total final energy consumption was 191.4 TWh in 2024 - still below 2010 - and electricity is only 27% of it, the frontier the electrification targets aim at6.
- The solar roadmap runs from 6.8 GW today to a 20.8 GW target by 2030, which at these yields implies roughly 35 TWh of generation1.
- The sunshine map is the yield map: 3,044 hours in Faro against 2,295 in Aveiro, a gradient the IPMA normals measure and the Alentejo's solar parks bank on3.
The system's remaining challenge is no longer generation but flexibility: hydro reservoirs and pumped storage must balance a wind-and-solar fleet whose output swings from 20% to over 100% of demand within a single week. Interconnection with Spain acts as a virtual battery, exporting summer solar surpluses and importing winter wind lulls. Battery storage auctions and green-hydrogen pilots are the next build-out phase, aimed at converting the country's renewable abundance into industrial advantage rather than curtailment.
Methodology
- PV yield: IEA-PVPS national survey average; modelled city value; labelled range
- Capacity and generation: IEA-PVPS 2025 update; REN 2024 and 2025 balances
- Final energy consumption: Eurostat nrg_bal_c 2010-2024 (official API)
- Solar resource: IPMA district sunshine-hour normals 1991-2020
- Storage: IHA pumped-storage figures and the government 2040 plan
Definition. 'Photovoltaic yield' (specific yield) is the energy a 1 kWp installed solar array produces per year, modelled from the solar resource - not metered output of real rooftops, which vary with orientation, shade and soiling. 'Final energy consumption' is Eurostat's FC_E: all energy consumed by end users, all fuels, converted at 1 Mtoe = 11.63 TWh. 'Renewable share' is renewables as a share of electricity consumption, as REN states it. No USD conversions were needed on this page.
Data sources. IEA-PVPS Portugal national survey and 2025 update; IEA Wind annual report; REN balances 2024-2025; Eurostat nrg_bal_c via API; IHA pumped-storage statements; Wikipedia hydro-dam list (Nov 2023); pvknowhow, gridpassport country reports (all labelled); IPMA sunshine normals via the sunny-days page dataset.
Calculations. KTOE converted to TWh at 11.63. The FEC projection is a least-squares line on 2010-2024 extended to 2050 - our calculation, not a forecast. The 1.7 TWh-per-GW solar arithmetic and the EUR 276 per-kWp annual value use the verified yield and the utilities page's 2025 household tariff (script: work/calc.py).
Limitations. PV yields are modelled, not metered; the 1,600 average is the IEA-PVPS survey figure and real installations vary with orientation, shade and degradation. No single official total hydro capacity was extractable - the page quotes the dam list (5,822 MW above 10 MW), the pumped fleet (>3.6 GW) and the renewables total (21.9 GW) as separately verified pieces. Small-hydro capacity is not separately verified. The 1,300 kWh/kWp figure of older searches is treated as the conservative floor. The FEC projection rests on 15 official years and ignores policy discontinuities.
Sources
- IEA-PVPS / IEA Wind. “Portugal national survey: average PV yield 1,600 kWh/kWp; 2025 update: 21.9 GW renewables, solar 6.8 GW, 8.7 TWh solar generation; wind additions 64 MW in 2024.” IEA-PVPS; IEA Wind, 2026. iea-pvps.org. Accessed 2026-09-18. Back to text
- REN - Redes Energeticas Nacionais. “2024 balance: renewables 36.7 TWh (71% of consumption); 2025: 37 TWh (68%); peak demand above 10 GW for the first time.” REN, 2026. ren.pt. Accessed 2026-09-18. Back to text
- IPMA (via the sunny-days page). “District sunshine-hour normals 1991-2020, the solar resource behind the yield.” Instituto Portugues do Mar e da Atmosfera, 2024. ipma.pt. Accessed 2026-09-18. Back to text
- Wikipedia dam list; pvknowhow; gridpassport (all labelled). “42 dams above 10 MW total 5,822 MW (Nov 2023); PV yield range 1,200-1,800+; Lisbon modelled 1,578 kWh/kWp.” Wikipedia; pvknowhow; gridpassport, 2026. pvknowhow.com. Accessed 2026-09-18. Back to text
- Porto Tours. “Own calculations: KTOE to TWh conversion, shares, per-kWp value (work/calc.py).” own calculation, 2026. porto.tours. Accessed 2026-09-18. Back to text
- Eurostat. “Final energy consumption, Portugal (nrg_bal_c, FC_E, TOTAL), 2010-2024.” European Commission - Eurostat, 2026. ec.europa.eu. Accessed 2026-09-18. Back to text
- International Hydropower Association (labelled). “Portugal operates more than 3.6 GW of pumped storage; government backs 5 GW by 2040 with EUR 400M.” IHA, 2026. hydropower.org. Accessed 2026-09-18. Back to text
About the author
Tiago Santos is a born-and-bred Tripeiro with nearly a decade chronicling Porto's shifting culinary and cultural landscape - from back-alley petisqueiras to contemporary architecture. A former contributor to Publico's Fugas supplement and Revista Visao, for this guide he turns official statistics and street-level knowledge into research visitors can check and cite.
Every figure on this page links to its source. How we research
Related research
More data on Porto's travel, costs and life from Porto Tours.
- EnvironmentPortugal CO2 Emissions per Capita 2000-2023 (2026 Data)3.54 t CO2 emissions per capita in Portugal 2023, down 43% since 2000Read the research →
- Cost of LivingHow Much Is Gas in Portugal? (2026 Data)EUR 2.12/L petrol (gasolina 95) average at Portuguese pumps, Sep 2026Read the research →
- WeatherPortugal Rainfall by Month (2026 Data)76% of Lisbon's yearly rain falls October-MarchRead the research →
- Visa & ImmigrationHow Much Is a Visa for Portugal? (2026 Data)EUR 90 Schengen short-stay visa fee for Portugal (2026)Read the research →
- Cost of LivingHow Much Does It Cost to Get Married in Portugal? (2026 Data)EUR 21,127 average 100-guest wedding in Portugal (2026)Read the research →
- Food & DrinkHow Much Is Food in Portugal? (2026 Data)EUR 12 average inexpensive-restaurant meal in Portugal (2026)Read the research →