Portugal GDP per Capita (2026 Data)
Portugal GDP per capita: $32,082 in 2025, an all-time high. The 65-year series, EU and world rankings, PPP vs nominal, the regional divide and the crisis years.
- Published
- Updated
- 7 sources
- 6 statistics
- 9 min read

- BA in Communication & Cultural Studies, Faculdade de Letras da Universidade do Porto (FLUP); MA candidate in Urban Anthropology
- Former urban culture contributor to Publico (Fugas supplement) and Revista Visao
- 8+ years documenting the gentrification and preservation of traditional Porto commerce for municipal cultural archives
- Field researcher for independent monographs on Northern Portuguese vernacular dining and tavern culture
- Born and raised in Miragaia; 4th-generation Tripeiro living in Cedofeita, where his family has run small businesses since the 1960s
- Covers urban culture, historic tascas, contemporary architecture and the Bonfim, Cedofeita, Campanha and Fontainhas neighbourhoods
- Tests every venue anonymously on foot and refuses all comped meals, so recommendations stay unsponsored

- BA in Journalism, Universidade Nova de Lisboa; Postgraduate Diploma in Wine Business & Gastronomic Criticism, Escola de Hotelaria e Turismo do Porto (EHTP)
- Former Deputy Editor at Time Out Portugal and Lifestyle Editor at Observador
- Member of the Portuguese Guild of Gastronomic and Wine Journalists (APGCV)
- Panelist and juror for regional gastronomy competitions, including Northern Portugal Craft Beer and D.O.C. Douro wine panels
- Advisor to independent cultural trusts focusing on architectural preservation in UNESCO World Heritage zones
- Porto native (Foz do Douro); 14+ years directing lifestyle, wine and travel coverage across Porto, London and Lisbon
- Enforces the zero-paid-placement policy - every vineyard, boutique stay and dining room featured earns its place on editorial merit
Key findings
- $32,082Portugal's GDP per capita reached $32,082 in 2025, an all-time high (World Bank).
- 82.4%Portugal's GDP per capita stood at 82.4% of the EU27 average in 2024 (INE).
- 128.9Grande Lisboa is Portugal's only region above the EU average, at 128.9 on the EU27 index.
- $53,146In purchasing power Portugal hit $53,146 in 2025 - yet Poland overtook it that year.
- 53rdPortugal ranks about 53rd in the world for nominal GDP per capita, and 47th in purchasing power.
- EUR 78bnThe 2011 EU-IMF bailout totalled EUR 78bn, equal to 45.9% of that year's GDP.
Portugal's GDP per capita reached $32,082 in 2025 - an all-time high, and the fourth straight year above the pre-crisis peak - yet the country still ranks in the lower half of western Europe by the same measure1. Sixty-five years of World Bank data tell both halves of that story: an economy that multiplied 85-fold in nominal dollars, and one that keeps waiting for the convergence with northern Europe to finish.
This page counts Portugal's output per person the way the statisticians do - World Bank series from 1960 to 2025, INE's regional accounts, IMF projections, Eurostat purchasing-power comparisons - and then translates it: Portugal against Spain and Poland, Lisbon against Porto, and the crisis years that left the deepest mark on the curve2.
Portugal GDP per capita: the one-minute answer
The Portugal GDP per capita 2025 figure reached $32,082, the highest ever recorded for the country, up 9.4% from the Portugal GDP per capita 2024 level of $29,328 in current dollars1. The GDP per capita of Portugal has now grown for four consecutive years, and the long trend - visible in the chart below - has carried the figure from $377 in 1960 to today's level, an 85-fold nominal increase driven partly by real growth and partly by prices and exchange rates2.
Read the Portugal GDP per capita by year table and three eras stand out: the slow climb of the 1960s and 70s, the fast convergence years after EEC accession in 1986, and the flat stretch from 2008 to 2014 when the crisis erased nearly a decade of progress1. The projection line continues the post-2015 recovery toward roughly $45,000 by 2050 - our calculation, not a forecast2.
The four eras in the table each have a date and a reason. The 1960s start from $377, one of the lowest figures in Western Europe, and the 1974 Carnation Revolution arrives mid-decade with the economy still agrarian. EEC accession in 1986 changes the trajectory: structural funds, a fixed exchange-rate policy and a tourism boom carry the figure from $6,768 in 1990 to $11,526 by the year 2000. The euro era begins flat - 2008 to 2014 leaves the figure lower than it found it - and the current era, from 2015 on, is the strongest sustained run in the series1.
One mechanical caveat belongs next to every headline number: the series is in current dollars, so exchange-rate swings move it without anything real changing. The euro's slide in 2014-2015 shrank the dollar figure even as the Portuguese economy grew; the euro's strength in 2025 did the opposite. For growth that excludes currency noise, use the real growth chart in the income section below2.
Portugal GDP per capita against the EU average tells the convergence story in one ratio: the EU figure was 1.96 times Portugal's in 1990, 1.47 by 2005, and 1.47 again in 2020 - twenty years of catching up, then a plateau at roughly two-thirds of the EU level that the 2023-2025 boom has only now begun to dent1.
Projection: linear trend of 1960–2025 yearly values, 95% prediction range. Our calculation, not a forecast.
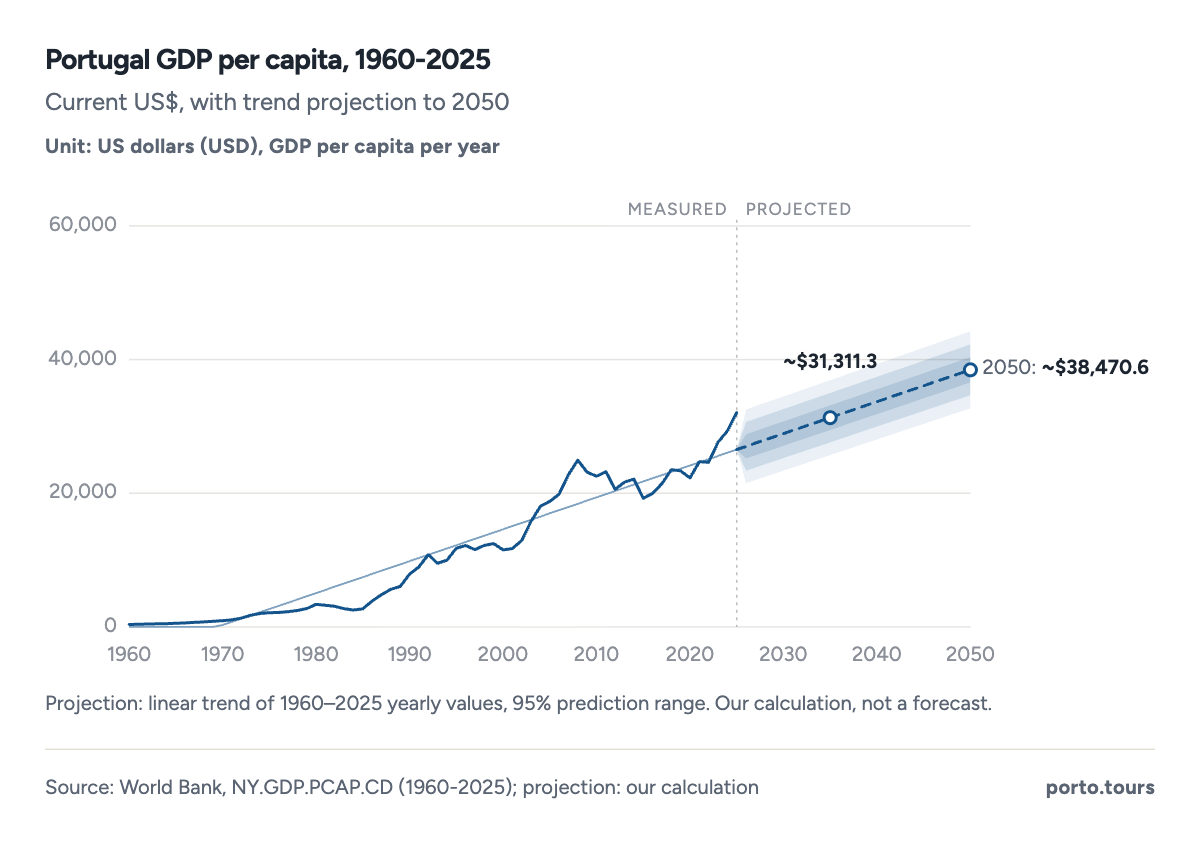
- Portugal's GDP per capita set its all-time high at $32,082 in 2025.
- In 1960 the figure was $377 - an 85-fold nominal rise over 65 years.
- The trend projection reaches about $38,500 by 2050 - our calculation, not a forecast.
| 1960 | 377 |
| 1968 | 752 |
| 1974 | 2,000 |
| 1980 | 3,368 |
| 1986 | 3,862 |
| 1990 | 7,885 |
| 1995 | 11,781 |
| 2000 | 11,526 |
| 2005 | 18,780 |
| 2008 | 24,949 |
| 2010 | 22,552 |
| 2012 | 20,593 |
| 2014 | 22,121 |
| 2016 | 19,980 |
| 2018 | 23,541 |
| 2020 | 22,299 |
| 2022 | 24,621 |
| 2023 | 27,635 |
| 2024 | 29,328 |
| 2025 | 32,082 |
Nominal vs purchasing power: two very different rankings
The Portugal GDP per capita nominal figure ($32,082) converts euros at market exchange rates; the purchasing-power version asks how much domestic output actually buys inside Portugal, where prices sit below the EU average. On the second measure Portugal reaches $53,146 international dollars in 2025 - 66% more than the nominal figure suggests1.
Purchasing power also changes who Portugal compares with. The Eurostat GDP per capita PPS Spain-Portugal 2024 pairing puts Portugal at 82.4% of the EU27 average, against Spain's roughly 90%3. And the GDP per capita Poland vs Portugal comparison has now flipped for good: Poland first finished ahead in 2020, Portugal reclaimed the lead in 2023 and 2024 ($52,513 against $51,263), and 2025 went back to Poland at $54,262 against $53,1461. The convergence chart shows how long that took: Portugal entered the 1990s about $4,000 ahead.
What the economy makes also frames the figures: services generate 76.1% of Portugal's gross value added, industry 21.5% and agriculture just 2.5%1. Both measures matter, and they answer different questions. Nominal dollars decide what Portugal earns in world markets; purchasing power decides what a Portuguese salary buys at home - which is why the gap between the two numbers is worth understanding before quoting either2.
A haircut makes the difference concrete. A Lisbon barber's cut costs less than a Berlin one, so a euro of Portuguese output buys more haircuts at home than abroad - that is exactly what the PPP conversion measures, and why Portugal's $53,146 PPP figure towers over its $32,082 nominal one. Eurostat's version of the same idea, the PPS index, sets the EU27 average to 100: Portugal at 82.4 means an average Portuguese resident consumes or invests about four-fifths of the EU-standard basket3.
The PPS index is also the figure Brussels uses for cohesion money. Regions below 75% of the EU average qualify for the largest structural-fund allocations - which, on the regional table below, means Norte (70.8) and Centro (70.7) - while a region above 100 has graduated out of that support entirely. The index is therefore both a statistic and a budget line, and Portugal runs one of the widest internal spreads in Western Europe between its richest capital region and its poorest interior3.
- EU aggregate
- Poland
- Portugal
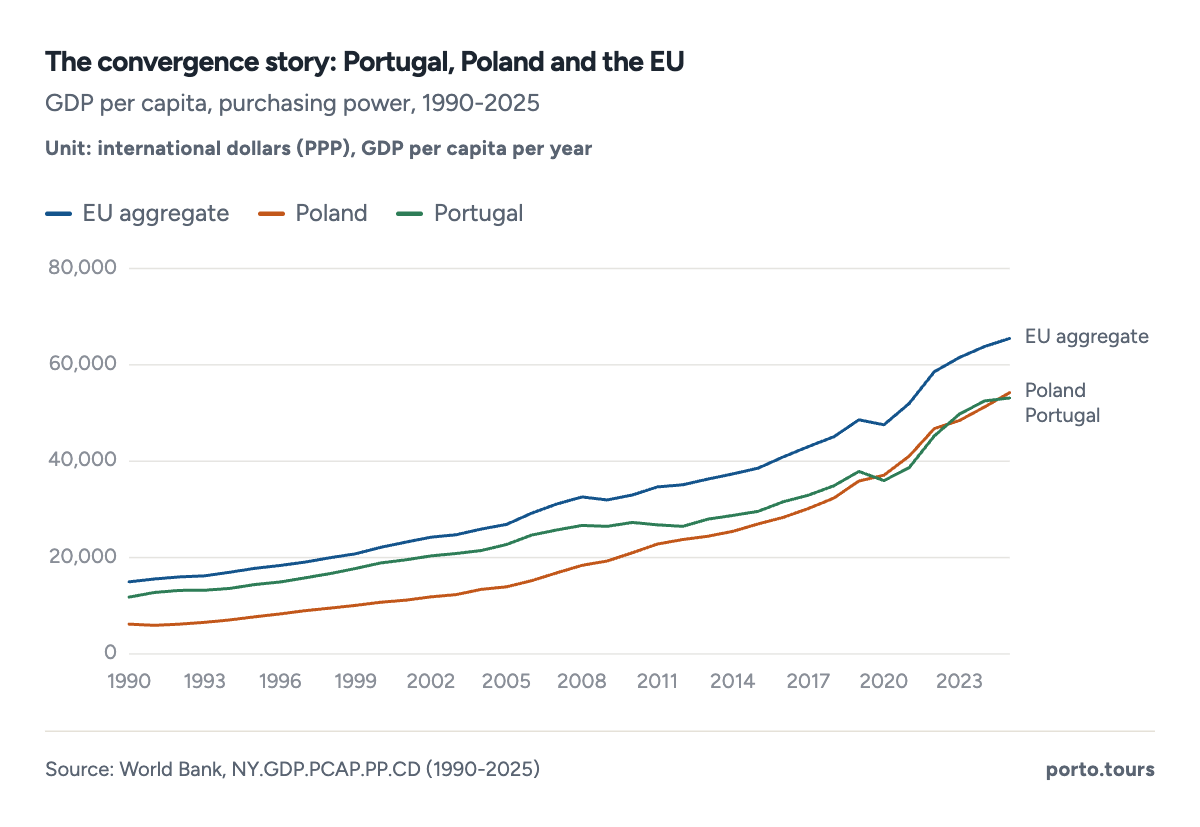
- Portugal entered 1990 ahead of Poland by roughly $4,000 in PPP terms.
- Poland's line crosses Portugal's in 2025 after a three-decade climb.
- The EU aggregate more than doubled over the same 35 years.
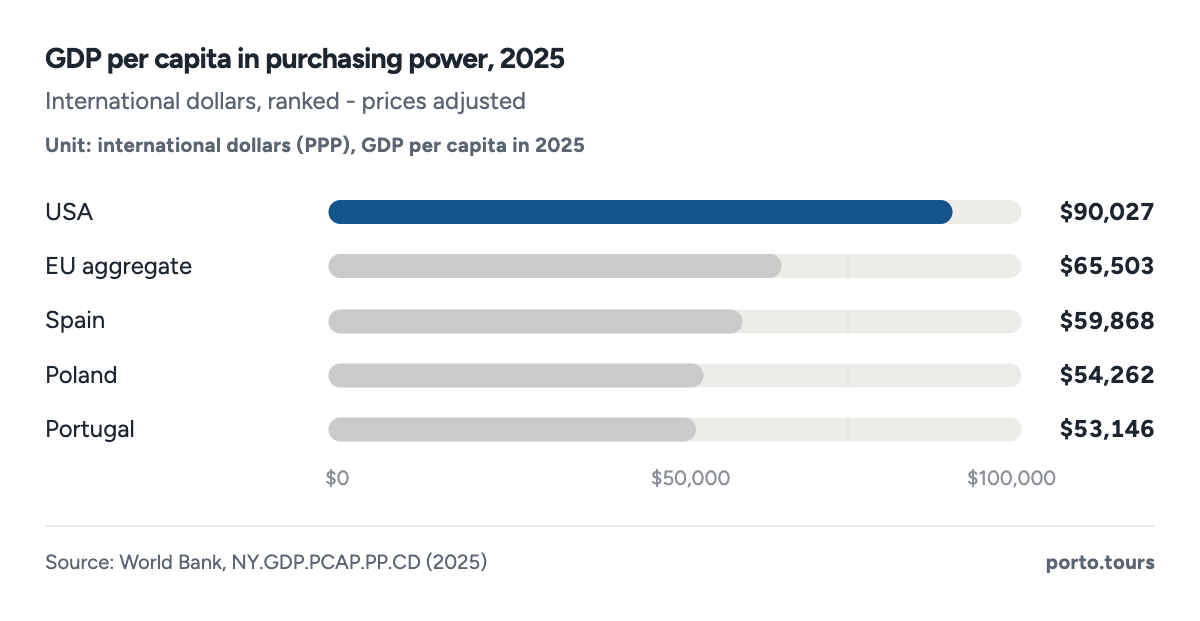
- In purchasing power Portugal reaches $53,146 - 81% of the EU aggregate.
- Poland ($54,262) finished ahead of Portugal in 2025, as it did in 2020-2022.
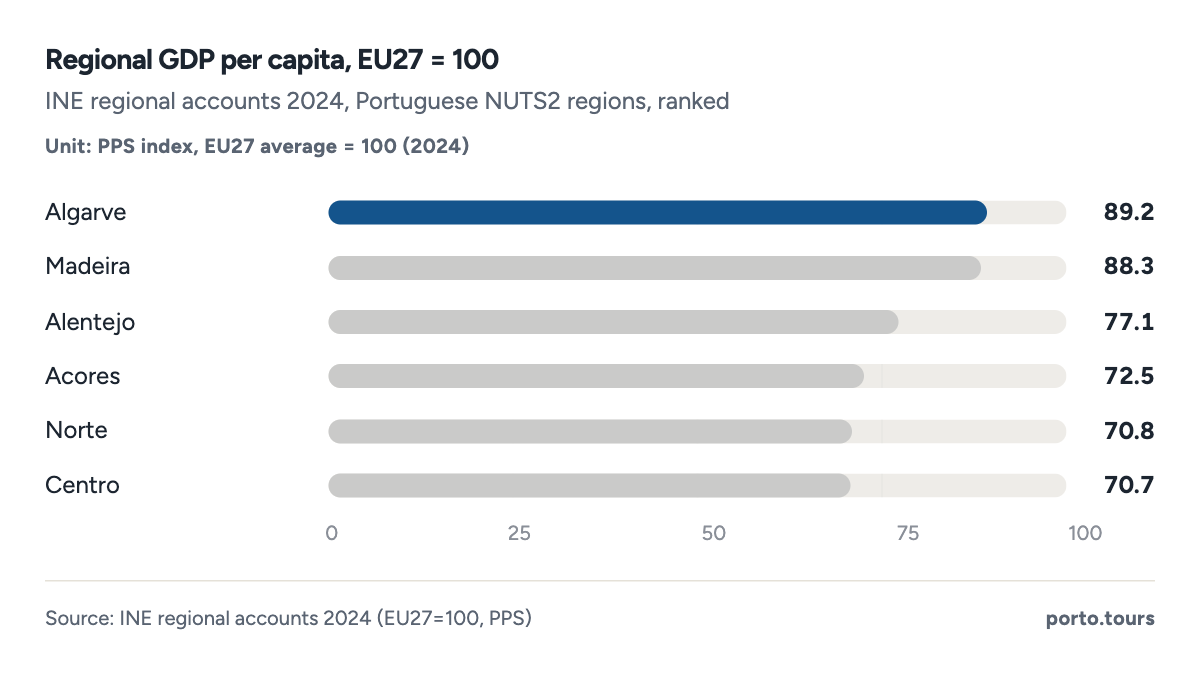
- The Algarve (89.2) and Madeira (88.3) lead the mainland-and-islands ranking.
- Norte and Centro sit at 70-71 - roughly 30% below the EU average.
GDP per capita: Portugal vs Spain
The comparison that defines Portugal's economic map is its Iberian neighbour. That gap in 2025 stands at $38,627 against $32,082 - Spain leads by 20% - and Spain has led in every single year of the 65-year series1. The gap narrowed sharply after Portugal's 1986 EEC accession, stayed narrow through the 2000s, and reopened after the 2011-2014 adjustment programme.
Further afield: the Germany vs Portugal GDP per capita 2024 score finished at $56,104 against $29,328 - Germany, at 1.9 times Portugal, widened the gap again after 20191. Brazil is the other direction: the Brazil vs Portugal GDP per capita score ended 2025 at $10,713 versus $32,082, meaning Portugal out-produces Brazil three to one per person - though in 2013 the ratio had narrowed to under two to one before Brazil's own recession1.
The Spain series rewards a longer look. Spain's lead peaked at 1.75 times Portugal in 1990, narrowed to 1.22 by 2020 as Portugal's euro-era convergence and tourism boom did their work, then settled at 1.20 in 2025 - the crisis cost Portugal a decade of the catch-up, and Spain's own post-pandemic growth has kept it ahead1. Both countries joined the EEC in the same year and adopted the euro in the same year, so the divergence is policy and productivity, not institutions or timeline.
Poland is the sharper cautionary tale. In 1990 its GDP per capita was a fraction of Portugal's; by 2025 it had overtaken Portugal on purchasing power while remaining behind in nominal dollars. Two paths diverged in the 2010s: Poland never had a domestic banking bust or an adjustment programme, and it absorbed a larger share of EU funds relative to its economy. Portugal's answer since 2015 - tourism-led growth and a services export boom - has been real, but it arrived a decade later than Poland's2.
- EU aggregate
- Spain
- Portugal
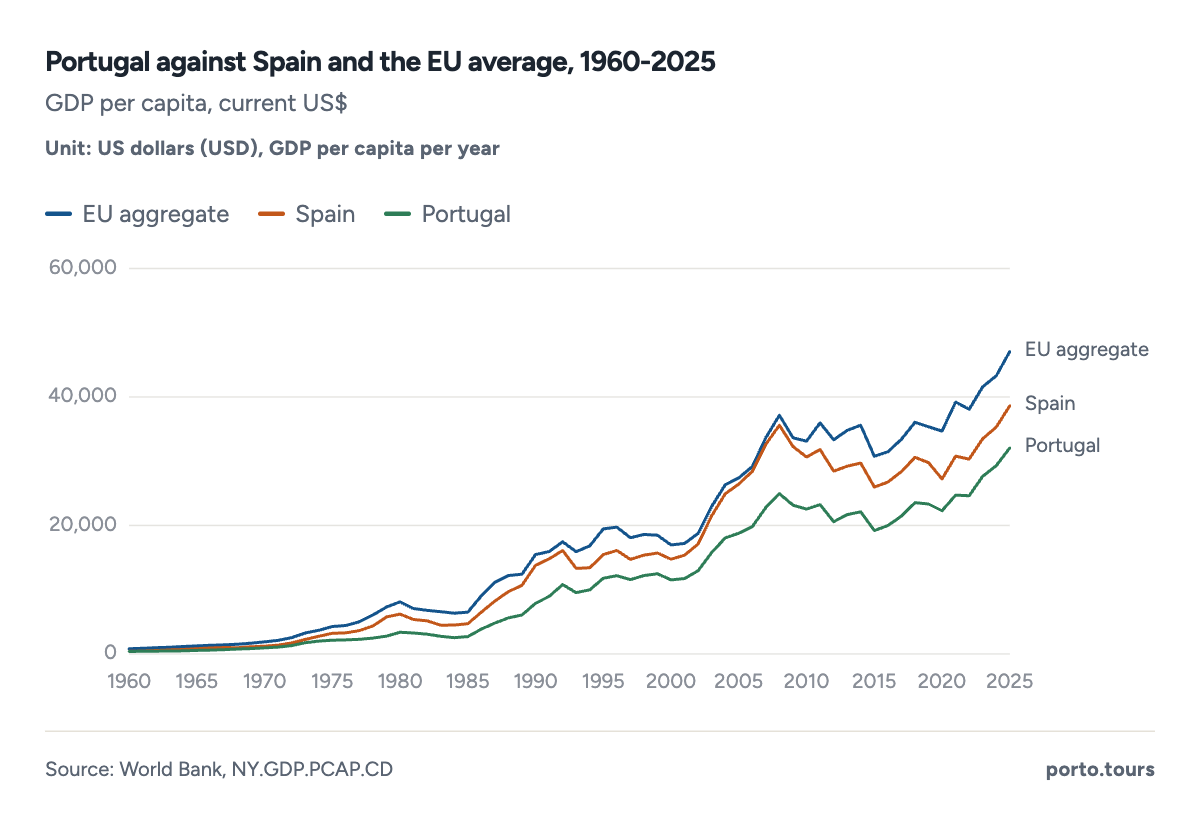
- Portugal tracked the EU aggregate until the early 2000s, then the gap opened.
- In 2025 the EU average ($47,089) was 47% above Portugal's figure.
- Spain led Portugal in every year of the series.
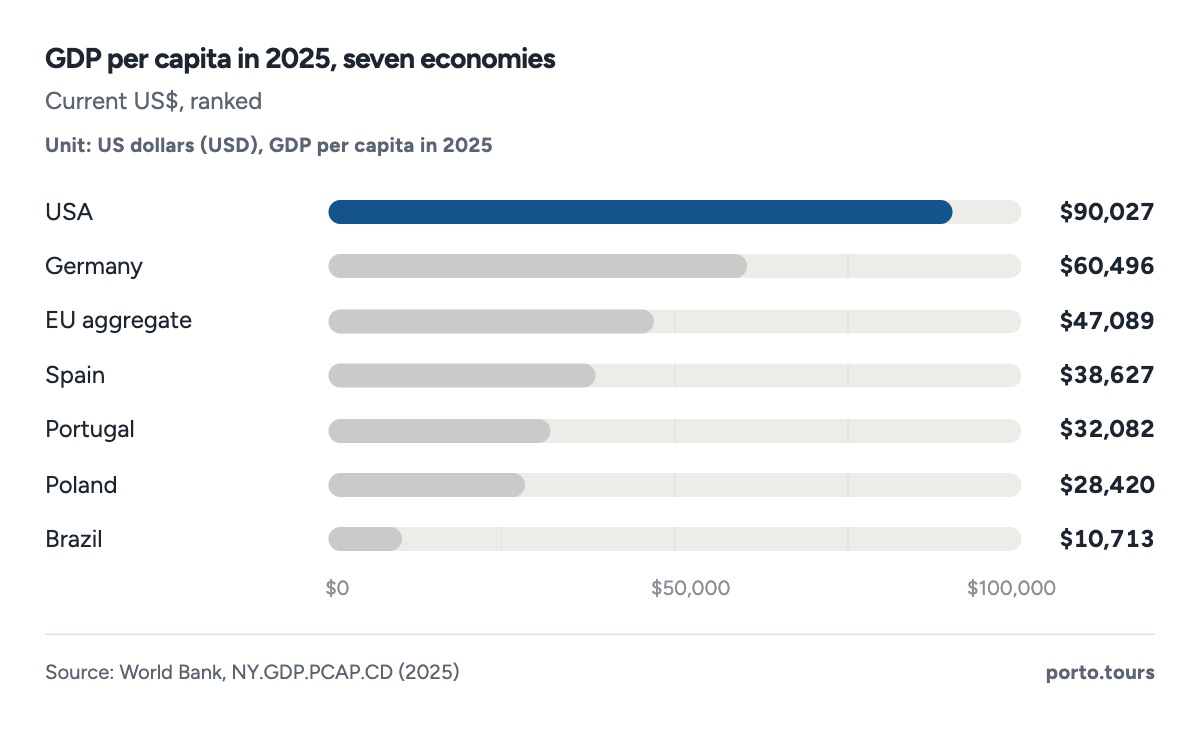
- Portugal's $32,082 sits 32% below the EU aggregate and 30% above Poland's nominal figure.
- The USA leads the seven at $90,027 - nearly three times Portugal.
| USA | 90,027 | 90,027 |
| Germany | 60,496 | - |
| EU aggregate | 47,089 | 65,503 |
| Spain | 38,627 | 59,868 |
| Portugal | 32,082 | 53,146 |
| Poland | 28,420 | 54,262 |
| Brazil | 10,713 | - |
Portugal GDP per capita ranking: Europe and the world
The Portugal GDP per capita ranking Europe 2024 places Portugal 18th of 27 EU countries by purchasing power - the middle of the pack, but behind every pre-2004 member except Greece, and now behind four post-communist economies (Czechia, Slovenia, Lithuania and Poland)5. By the Portugal GDP per capita world rank 2023 measure, Portugal sits around 53rd of roughly 200 economies in nominal terms and 47th in purchasing power, per the IMF's April 2026 outlook tables6.
The Portugal GDP per capita 2025 IMF figure came in at $32,100 - within a rounding error of the World Bank's - and the 2026 projection extends the series to $35,434 nominal and $52,841 in PPP terms, continuing the record run but not closing the EU gap6. The ranking table in this section collects the denominators - and the honest caveat: world-rank figures move a dollar or two depending on the aggregator, so the band, not the digit, is the datapoint5.
What the ranking does not show is composition. Portugal's nominal figure rides on a services and tourism economy where prices are low and wages lower; the PPP adjustment flatters it; and the EU ranking by PPS (18th) is kinder than the eurozone-only ranking, where only Greece sits clearly below. For a traveller the practical translation is modest: a Portuguese GDP per capita of $32,082 buys the public services, safety and infrastructure of a high-income country delivered at the price level of its southern half2.
| Nominal GDP per capita (USD) | 32,100 | 35,434 |
| GDP per capita, PPP (int$) | 50,269 | 52,841 |
By region: the north-south divide in one index
Regional accounts split the country sharply. INE's 2024 figures, indexed to the EU27 average, run from the Algarve's 89.2 and Madeira's 88.3 down to Centro's 70.7 - and the two metros tell the sharpest story: Grande Lisboa stands at 128.9, Portugal's only region above the EU average, while Tamega e Sousa in the interior Norte sits at 53.1, the country's lowest4.
Where does the Porto GDP per capita figure land in that divide? The Area Metropolitana do Porto posted EUR 25,942 per person - an index of 95.9, within touching distance of the EU line but visibly below Lisbon's metro4. The Norte region as a whole sits at 70.8: its metro pulls the average up, and the interior valleys (Tamega e Sousa, Ave) pull it down - the classic two-speed map of a European periphery2.
The divide also runs through the visitor economy. The Algarve's 89.2 index is built on tourism and services that peak with the summer flights; Madeira's 88.3 rides the same effect across a year-round season. Norte's 70.8, by contrast, mixes the Porto metro's export machinery with an interior that has been emptying since the 1960s - which is why the regional table's spread of 18 index points understates the gap a visitor feels between the Matosinhos docks and a village in Tamega e Sousa, 53.1, less than an hour inland2.
Projection: linear trend of 1990–2025 yearly values, 95% prediction range. Our calculation, not a forecast.
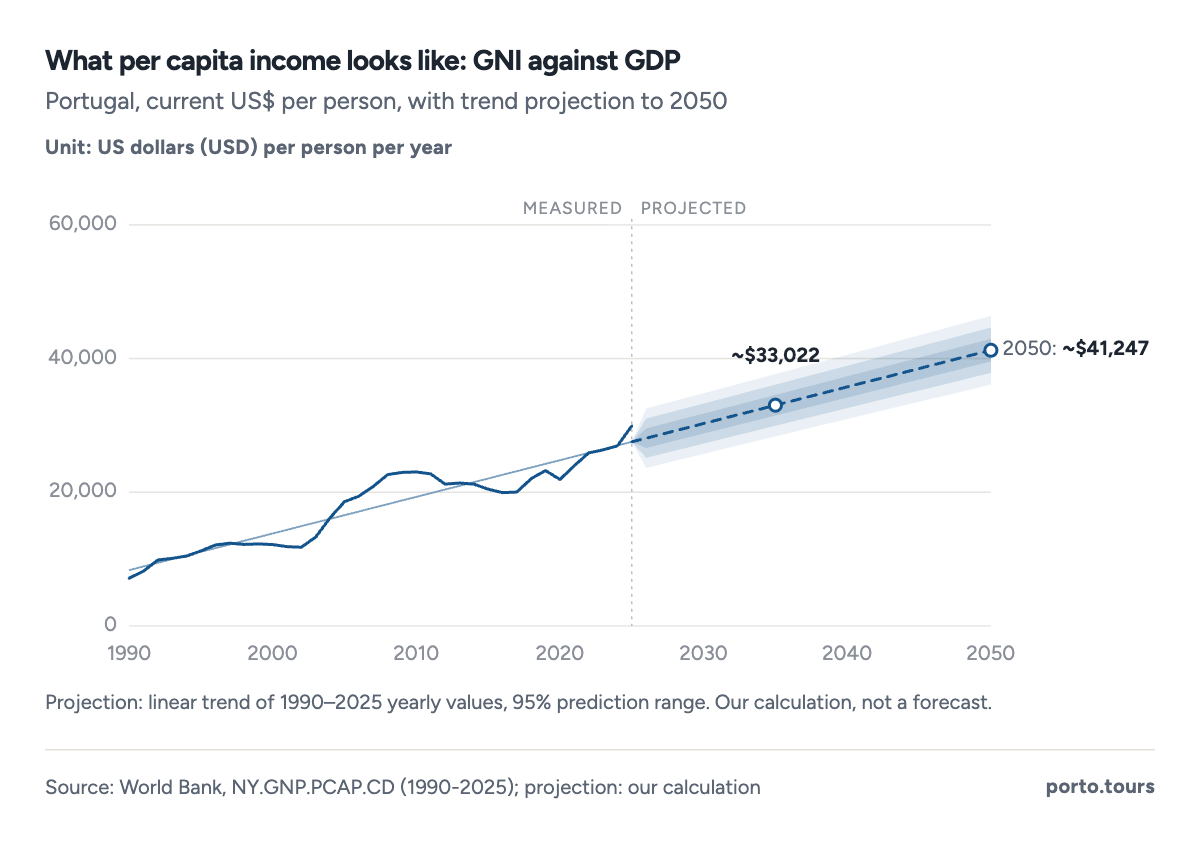
- GNI per capita reached $29,930 in 2025 - the income counterpart of the $32,082 GDP figure.
- The GNI-GDP gap reflects foreign profits repatriated from Portugal.
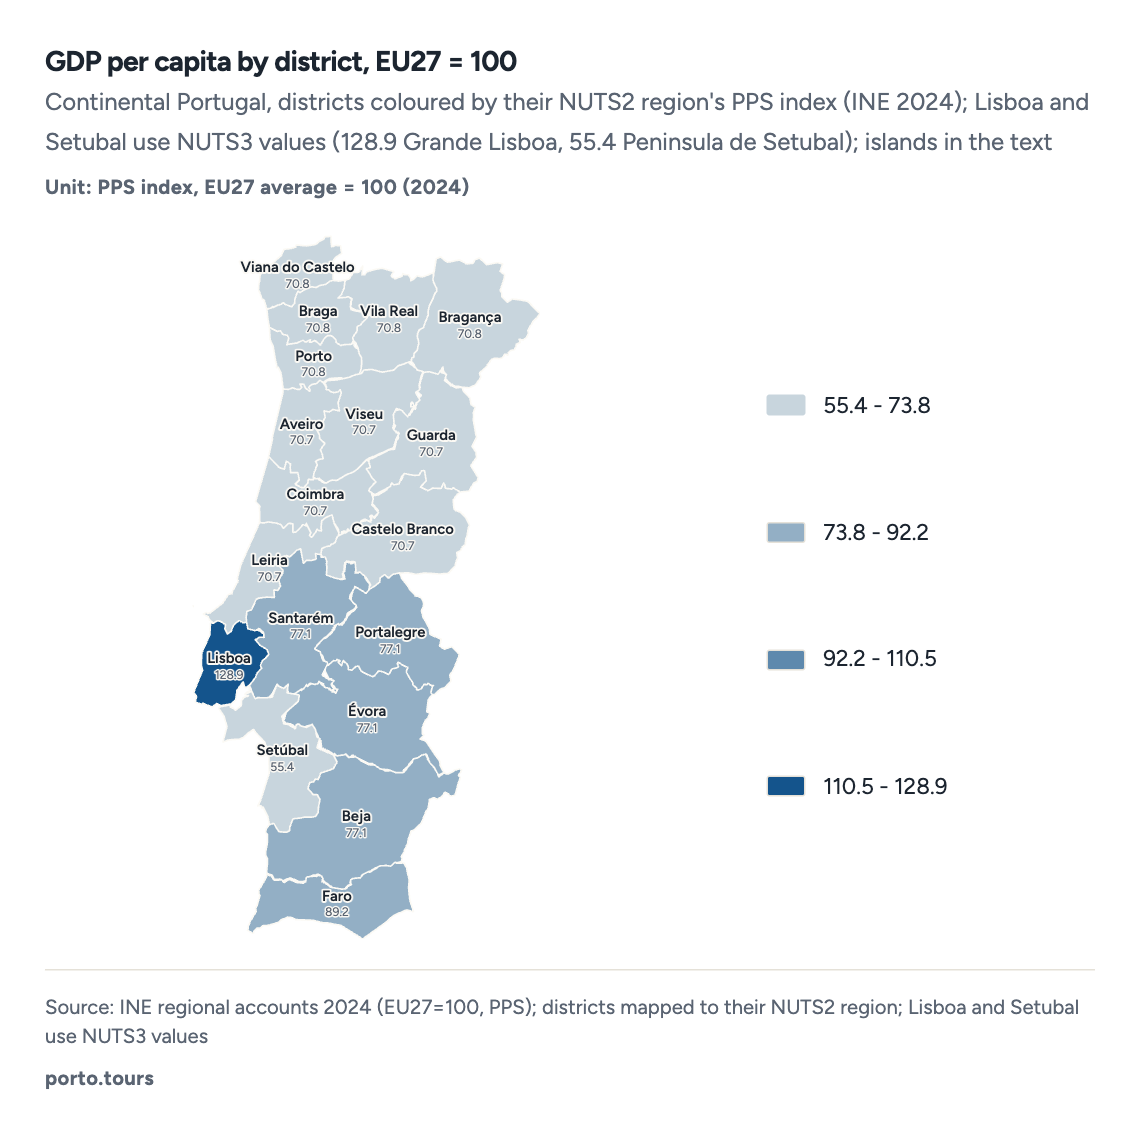
- Every Norte and Centro district sits at 70-71 - the low-index half of the country.
- The Algarve (89.2) is the highest-indexed mainland region on the map.
- Lisboa district (128.9, NUTS3) is the only territory above the EU average.
| Algarve | 89.2 |
| Madeira | 88.3 |
| Alentejo | 77.1 |
| Acores | 72.5 |
| Norte | 70.8 |
| Centro | 70.7 |
| Portugal (national) | 82.4 |
| EU27 average | 100.0 |
| Grande Lisboa | 128.9 | Portugal's only region above the EU average |
| Area Metropolitana do Porto | 95.9 | just under the EU line (EUR 25,942 per person) |
| Tamega e Sousa (interior Norte) | 53.1 | the lowest in the country |
Income and growth: what the per-capita figure actually pays
GDP per person is production, not take-home pay. The income-side counterpart, GNI per capita, reached $29,930 in 2025 - about $2,150 below the GDP figure, the slice of output earned by foreign capital that leaves the country each year1. The Portugal per capita income angle also has a Eurostat version: actual individual consumption per head runs lower still, which is why researchers quote GNI and consumption separately rather than blending them into GDP2.
On momentum, the Portugal GDP growth rate 2025 printed +1.9% after +2.1% in 2024 and +3.1% in 2023 - three of the strongest years since the century began, driven by tourism records, services exports and EU recovery funds1. The growth line below shows why the level matters more than any single year: the 2011-2013 crisis (-1.7%, -4.1%, -0.9%) erased three years of output and forced the EUR 78 billion programme, while the 2020 pandemic dip was sharper but far shorter7.
Why does the gap between the two lines matter to a reader? GNI subtracts what foreign investors earn in Portugal and adds back what Portuguese investors earn abroad. A persistent GNI-below-GDP gap - visible across the whole series - means a structurally open economy that hosts more foreign capital than it sends out. It is neither good nor bad on its own, but it is the honest divider between the output a country produces and the income its residents keep, and on that measure Portugal's 2025 income per person is $29,930, not $32,0821.
- Services76.1%76%
- Industry21.5%21.5%
- Agriculture2.5%2.5%
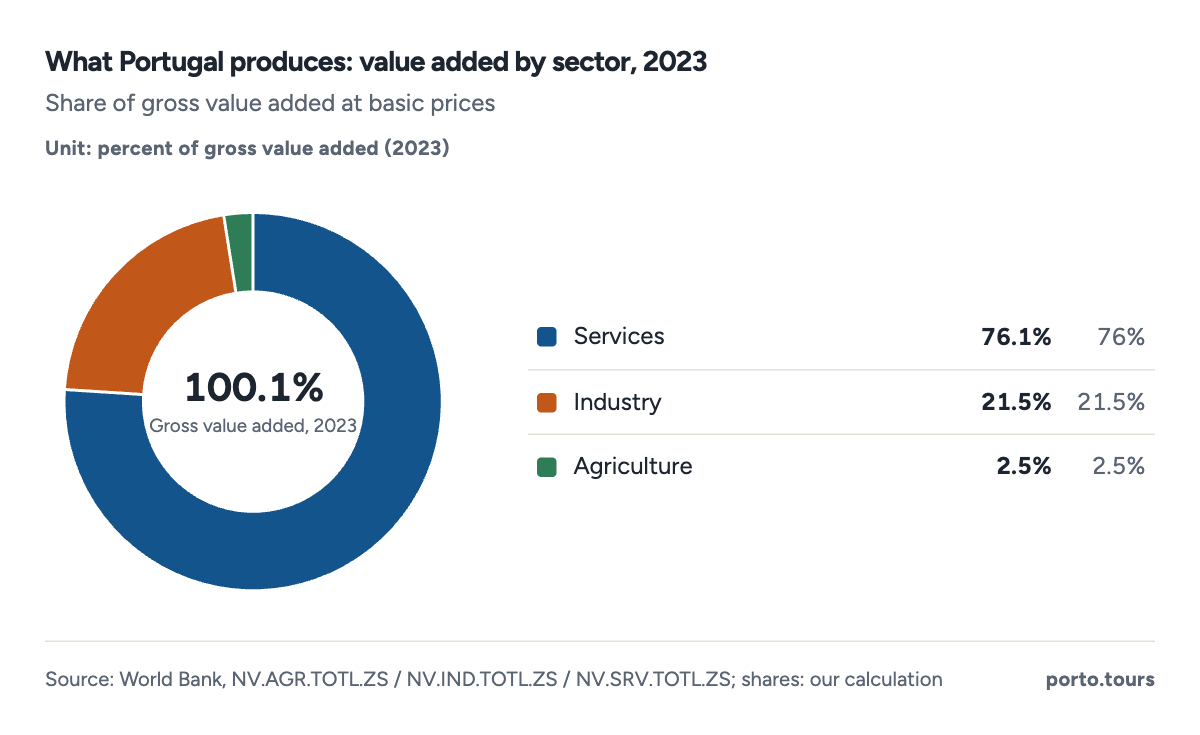
- Services produce 76.1% of Portugal's value added - agriculture just 2.5%.
- The share of the three sectors adds to 100% of gross value added (taxes on products excluded).
Projection: linear trend of 1971–2025 yearly values, 95% prediction range. Our calculation, not a forecast.
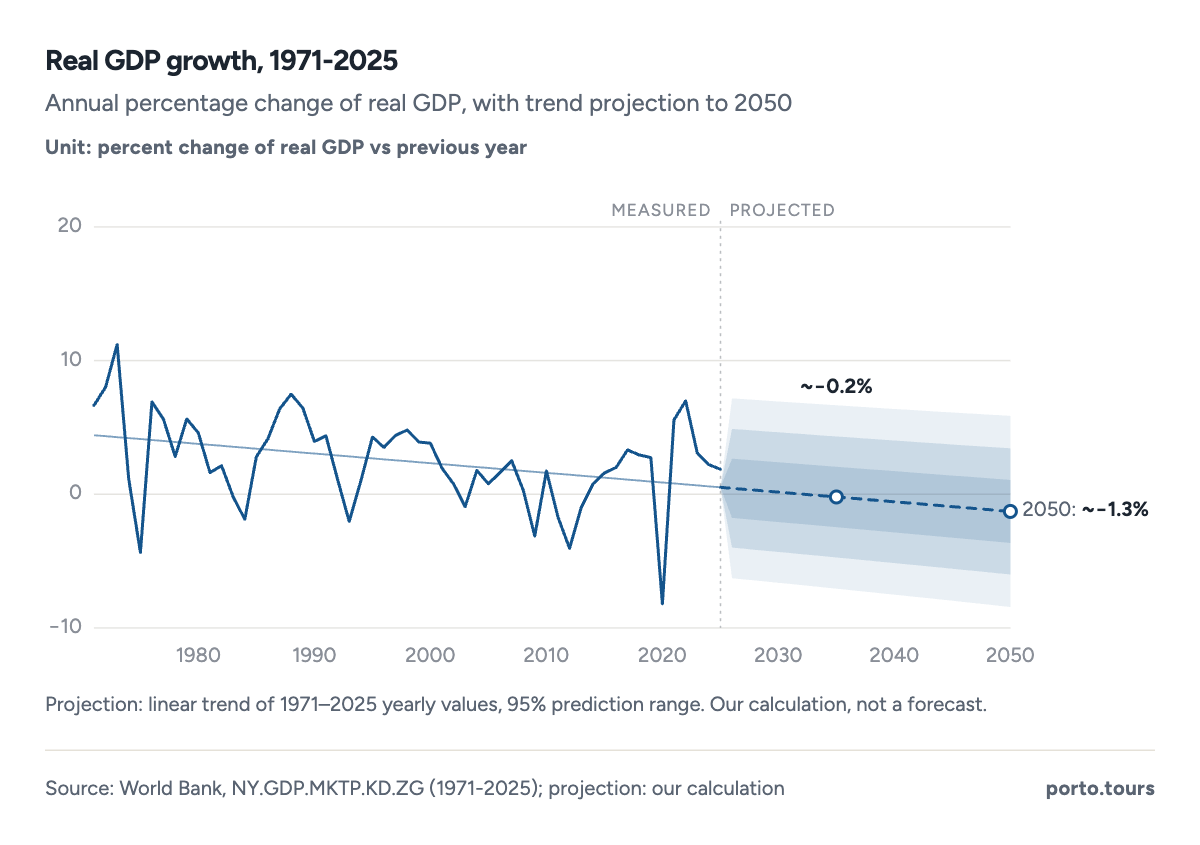
- 2012 was the worst year in the series at -4.1%.
- The 2011-2013 crisis years stack three consecutive contractions.
- 2023-2025 delivered three solid years: +3.1%, +2.1% and +1.9%.
| 2007 | 2.51 |
| 2008 | 0.32 |
| 2009 | −3.12 |
| 2010 | 1.74 |
| 2011 | −1.71 |
| 2012 | −4.05 |
| 2013 | −0.98 |
| 2014 | 0.74 |
| 2015 | 1.59 |
| 2020 | −8.2 |
| 2021 | 5.56 |
| 2022 | 6.99 |
| 2023 | 3.1 |
| 2024 | 2.21 |
| 2025 | 1.86 |
| Bailout agreed | May 2011: EUR 78 billion (EU-IMF) |
| Bailout size vs economy | 45.9% of 2011 GDP |
| Worst contraction | 2012: -4.1% (worst in 40 years) |
| Programme exit | June 2014, without a follow-up programme |
| Unemployment peak | about 17% (Q1 2013) |
| Total GDP, trough to 2025 | $226.7 bn (2013) to $346.6 bn |
| 2024 (INE, first estimate) | 26,697 |
| 2024 (INE, revised) | 27,096 |
| 2025 (published estimates) | 28,500 |
Conclusions
- Portugal GDP per capita hit its all-time high in 2025 at $32,082, up 85-fold in nominal dollars since the series began at $377 in 19601.
- Purchasing power flips the story twice over: Portugal reaches $53,146 in PPP terms - 66% above its nominal figure - yet Poland overtook it on exactly this measure in 20251.
- The EU convergence is unfinished: at 82.4% of the EU27 average in 2024, Portugal ranks about 18th of 27, behind four post-communist economies that started the century far poorer3.
- The regional divide is the country's sharpest economic fact: Grande Lisboa stands at 128.9 on the EU27 index while Tamega e Sousa sits at 53.1 - and the Porto metro, at 95.9, is close enough to the EU line to see it from there4.
- The crisis left a permanent scar in the curve - three contraction years and a EUR 78 billion programme - but 2023-2025 (+3.1%, +2.1%, +1.9%) delivered the strongest run since the century began1.
Methodology
- Nominal and PPP GDP per capita: 1960-2025 (World Bank, 7 economies)
- Real GDP growth and total GDP: 1971-2025 (World Bank)
- Regional PPS indices: 2024 (INE regional accounts); IMF WEO projections (April 2026)
Definition. GDP per capita is gross domestic product at current prices divided by total population. The nominal figure converts euros to US dollars at market exchange rates; the PPP (purchasing power standard) figure adjusts for price-level differences, so it answers 'what does output buy', not 'what does it sell for'. GNI per capita replaces foreign repatriated profits to approximate income. Regional indices use PPS with the EU27 average set to 100.
Data sources. World Bank Open Data (NY.GDP.PCAP.CD, NY.GDP.PCAP.PP.CD, NY.GNP.PCAP.CD, NY.GDP.MKTP.KD.ZG, NY.GDP.MKTP.CD); IMF World Economic Outlook April 2026 (via published aggregators, labelled); INE regional accounts 2024 and national EUR figures; Eurostat PPS indices; IMF Portugal programme documents; FFMS/Brookings unemployment series (labelled).
Calculations. Percentage gaps, the Poland-overtakes-Portugal comparison and the continentality of the crisis narrative are our calculations from the World Bank series. The projection is an ordinary least-squares trend with a 95% prediction interval, computed by the renderer; our calculation, not a forecast. EUR figures are quoted from INE, not converted by us.
Limitations. World Bank current-dollar figures move with exchange rates, so year-on-year jumps are partly currency, not growth. IMF WEO figures are cited from published aggregators because the IMF datamapper is not directly extractable; world ranks vary by 1-2 positions between aggregators. The 2025 World Bank values are latest-available and may be revised. AML (Lisbon metropolitan area) has no published NUTS2 aggregate for 2024 - INE publishes the NUTS3 Grande Lisboa figure instead.
Sources
- World Bank. “World Development Indicators: GDP per capita (NY.GDP.PCAP.CD), GDP per capita PPP (NY.GDP.PCAP.PP.CD), GNI per capita (NY.GNP.PCAP.CD), GDP growth (NY.GDP.MKTP.KD.ZG), GDP (NY.GDP.MKTP.CD).” World Bank Open Data, 2026. data.worldbank.org. Accessed 2026-09-18. Back to text
- Porto Tours. “Own calculations (labelled).” own calculation, 2026. porto.tours. Accessed 2026-09-18. Back to text
- European Commission / Eurostat. “Portugal GDP per capita PPS as % of EU27 average (2023-2024); EU average PPS 2025.” European Commission, 2026. ec.europa.eu. Accessed 2026-09-18. Back to text
- Statistics Portugal / INE. “Regional accounts 2024: GDP per capita PPS, EU27=100 (NUTS2 and NUTS3); national GDP per capita in EUR.” Instituto Nacional de Estatistica, 2025. ine.pt. Accessed 2026-09-18. Back to text
- Portuguese and international media / research institutes. “Crisis unemployment peak, EUR GDP per capita estimates, South Korea comparison (labelled).” FFMS, Brookings, FocusEconomics, StatisticsTimes, 2026. ffms.pt. Accessed 2026-09-18. Back to text
- IMF. “World Economic Outlook, April 2026 edition - Portugal projections (nominal and PPP GDP per capita, world ranks).” International Monetary Fund, 2026. imf.org. Accessed 2026-09-18. Back to text
- IMF. “Portugal economic programme 2011-2014: EUR 78 billion EU-IMF adjustment (45.9% of 2011 GDP).” International Monetary Fund (official), 2014. imf.org. Accessed 2026-09-18. Back to text
About the author
Tiago Santos is a born-and-bred Tripeiro with nearly a decade chronicling Porto's shifting culinary and cultural landscape - from back-alley petisqueiras to contemporary architecture. A former contributor to Publico's Fugas supplement and Revista Visao, for this guide he turns official statistics and street-level knowledge into research visitors can check and cite.
Every figure on this page links to its source. How we research
Related research
More data on Porto's travel, costs and life from Porto Tours.
- EconomyPortugal Median Income (2026 Data)EUR 12,646 Portugal's median annual income (Eurostat 2024)Read the research →
- Travel PlanningHow Much Is a Flight to Portugal? (2026 Data)USD 675 average round trip, New York to Lisbon (Kayak average)Read the research →
- Travel PlanningHow Much Does It Cost to Go to Portugal? (2026 Data)$539-$3,101 what a week in Portugal costs per personRead the research →
- WeatherPortugal Weather by Month (2026 Data)15.66 °C Portugal's annual mean temperature (IPMA 1991-2020)Read the research →
- Travel PlanningHow Much to Tip in Portugal (2026 Data)5-10% typical restaurant tip in Portugal (voluntary, cash preferred)Read the research →
- EnvironmentPortugal CO2 Emissions per Capita 2000-2023 (2026 Data)3.54 t CO2 emissions per capita in Portugal 2023, down 43% since 2000Read the research →